Kiowa vs Immigrants from Australia Householder Income Ages 25 - 44 years
COMPARE
Kiowa
Immigrants from Australia
Householder Income Ages 25 - 44 years
Householder Income Ages 25 - 44 years Comparison
Kiowa
Immigrants from Australia
$74,776
HOUSEHOLDER INCOME AGES 25 - 44 YEARS
0.0/ 100
METRIC RATING
335th/ 347
METRIC RANK
$115,947
HOUSEHOLDER INCOME AGES 25 - 44 YEARS
100.0/ 100
METRIC RATING
17th/ 347
METRIC RANK
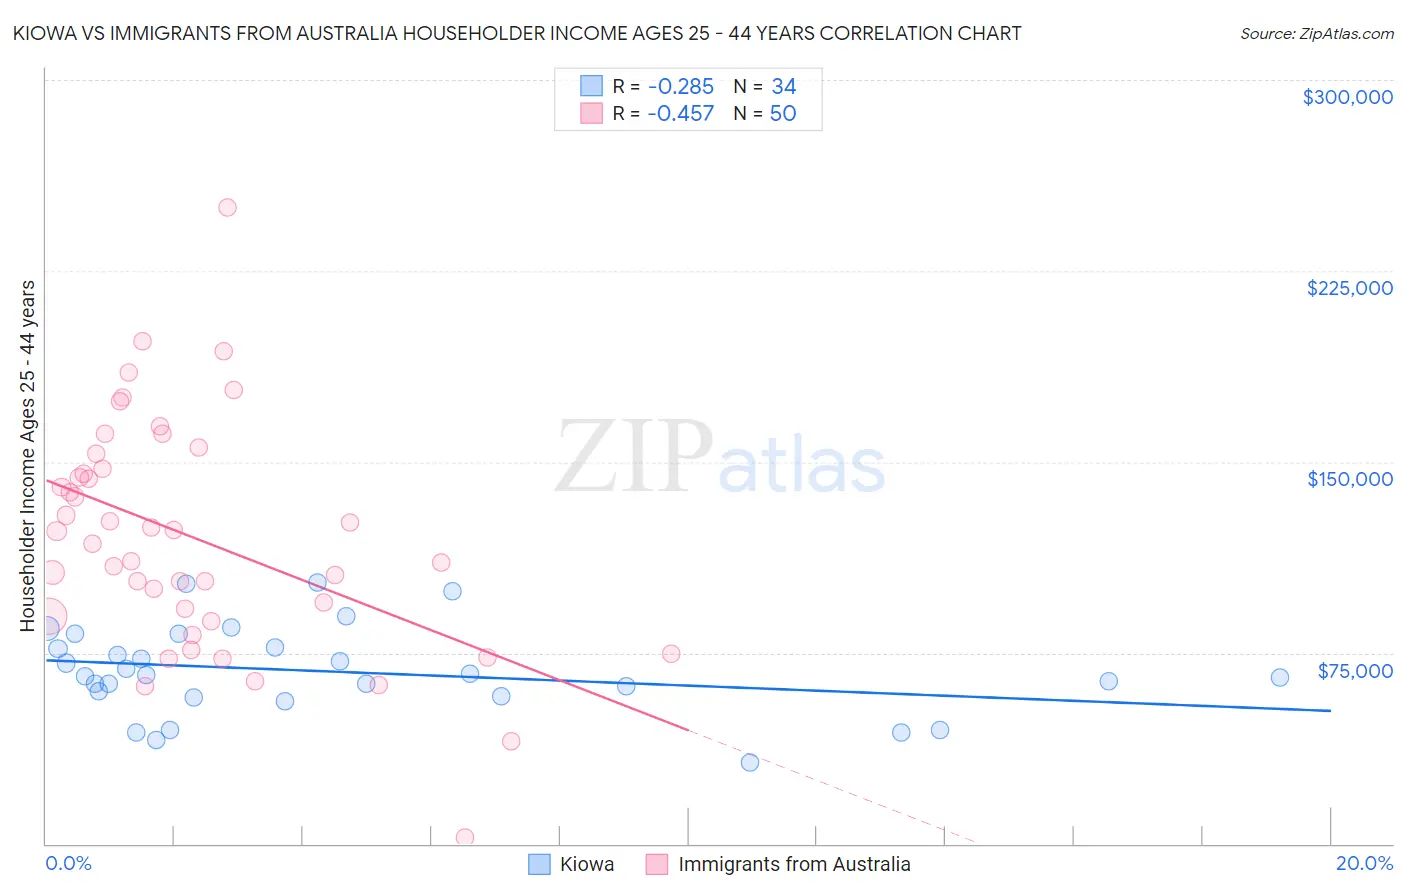
Kiowa vs Immigrants from Australia Householder Income Ages 25 - 44 years Correlation Chart
The statistical analysis conducted on geographies consisting of 56,084,974 people shows a weak negative correlation between the proportion of Kiowa and household income with householder between the ages 25 and 44 in the United States with a correlation coefficient (R) of -0.285 and weighted average of $74,776. Similarly, the statistical analysis conducted on geographies consisting of 226,902,734 people shows a moderate negative correlation between the proportion of Immigrants from Australia and household income with householder between the ages 25 and 44 in the United States with a correlation coefficient (R) of -0.457 and weighted average of $115,947, a difference of 55.1%.
Householder Income Ages 25 - 44 years Correlation Summary
| Measurement | Kiowa | Immigrants from Australia |
| Minimum | $31,875 | $2,499 |
| Maximum | $102,750 | $250,001 |
| Range | $70,875 | $247,502 |
| Mean | $67,591 | $120,207 |
| Median | $65,895 | $120,330 |
| Interquartile 25% (IQ1) | $57,875 | $89,211 |
| Interquartile 75% (IQ3) | $77,000 | $147,110 |
| Interquartile Range (IQR) | $19,125 | $57,899 |
| Standard Deviation (Sample) | $17,380 | $45,319 |
| Standard Deviation (Population) | $17,122 | $44,864 |
Similar Demographics by Householder Income Ages 25 - 44 years
Demographics Similar to Kiowa by Householder Income Ages 25 - 44 years
In terms of householder income ages 25 - 44 years, the demographic groups most similar to Kiowa are Creek ($74,847, a difference of 0.10%), Hopi ($75,002, a difference of 0.30%), Bahamian ($75,395, a difference of 0.83%), Native/Alaskan ($75,647, a difference of 1.2%), and Yup'ik ($73,688, a difference of 1.5%).
| Demographics | Rating | Rank | Householder Income Ages 25 - 44 years |
| Immigrants | Cuba | 0.0 /100 | #328 | Tragic $76,701 |
| Seminole | 0.0 /100 | #329 | Tragic $76,584 |
| Yakama | 0.0 /100 | #330 | Tragic $76,226 |
| Natives/Alaskans | 0.0 /100 | #331 | Tragic $75,647 |
| Bahamians | 0.0 /100 | #332 | Tragic $75,395 |
| Hopi | 0.0 /100 | #333 | Tragic $75,002 |
| Creek | 0.0 /100 | #334 | Tragic $74,847 |
| Kiowa | 0.0 /100 | #335 | Tragic $74,776 |
| Yup'ik | 0.0 /100 | #336 | Tragic $73,688 |
| Blacks/African Americans | 0.0 /100 | #337 | Tragic $73,370 |
| Immigrants | Yemen | 0.0 /100 | #338 | Tragic $73,043 |
| Yuman | 0.0 /100 | #339 | Tragic $72,956 |
| Immigrants | Congo | 0.0 /100 | #340 | Tragic $72,178 |
| Arapaho | 0.0 /100 | #341 | Tragic $71,697 |
| Crow | 0.0 /100 | #342 | Tragic $71,337 |
Demographics Similar to Immigrants from Australia by Householder Income Ages 25 - 44 years
In terms of householder income ages 25 - 44 years, the demographic groups most similar to Immigrants from Australia are Cypriot ($116,364, a difference of 0.36%), Immigrants from South Central Asia ($116,626, a difference of 0.59%), Immigrants from Israel ($117,219, a difference of 1.1%), Eastern European ($114,523, a difference of 1.2%), and Immigrants from Eastern Asia ($118,056, a difference of 1.8%).
| Demographics | Rating | Rank | Householder Income Ages 25 - 44 years |
| Indians (Asian) | 100.0 /100 | #10 | Exceptional $119,496 |
| Okinawans | 100.0 /100 | #11 | Exceptional $119,349 |
| Immigrants | Iran | 100.0 /100 | #12 | Exceptional $119,204 |
| Immigrants | Eastern Asia | 100.0 /100 | #13 | Exceptional $118,056 |
| Immigrants | Israel | 100.0 /100 | #14 | Exceptional $117,219 |
| Immigrants | South Central Asia | 100.0 /100 | #15 | Exceptional $116,626 |
| Cypriots | 100.0 /100 | #16 | Exceptional $116,364 |
| Immigrants | Australia | 100.0 /100 | #17 | Exceptional $115,947 |
| Eastern Europeans | 100.0 /100 | #18 | Exceptional $114,523 |
| Burmese | 100.0 /100 | #19 | Exceptional $113,701 |
| Immigrants | Korea | 100.0 /100 | #20 | Exceptional $113,401 |
| Asians | 100.0 /100 | #21 | Exceptional $112,666 |
| Immigrants | Belgium | 100.0 /100 | #22 | Exceptional $112,575 |
| Immigrants | Japan | 100.0 /100 | #23 | Exceptional $112,228 |
| Immigrants | Sweden | 100.0 /100 | #24 | Exceptional $112,010 |