Kiowa vs Fijian Householder Income Ages 25 - 44 years
COMPARE
Kiowa
Fijian
Householder Income Ages 25 - 44 years
Householder Income Ages 25 - 44 years Comparison
Kiowa
Fijians
$74,776
HOUSEHOLDER INCOME AGES 25 - 44 YEARS
0.0/ 100
METRIC RATING
335th/ 347
METRIC RANK
$79,956
HOUSEHOLDER INCOME AGES 25 - 44 YEARS
0.0/ 100
METRIC RATING
310th/ 347
METRIC RANK
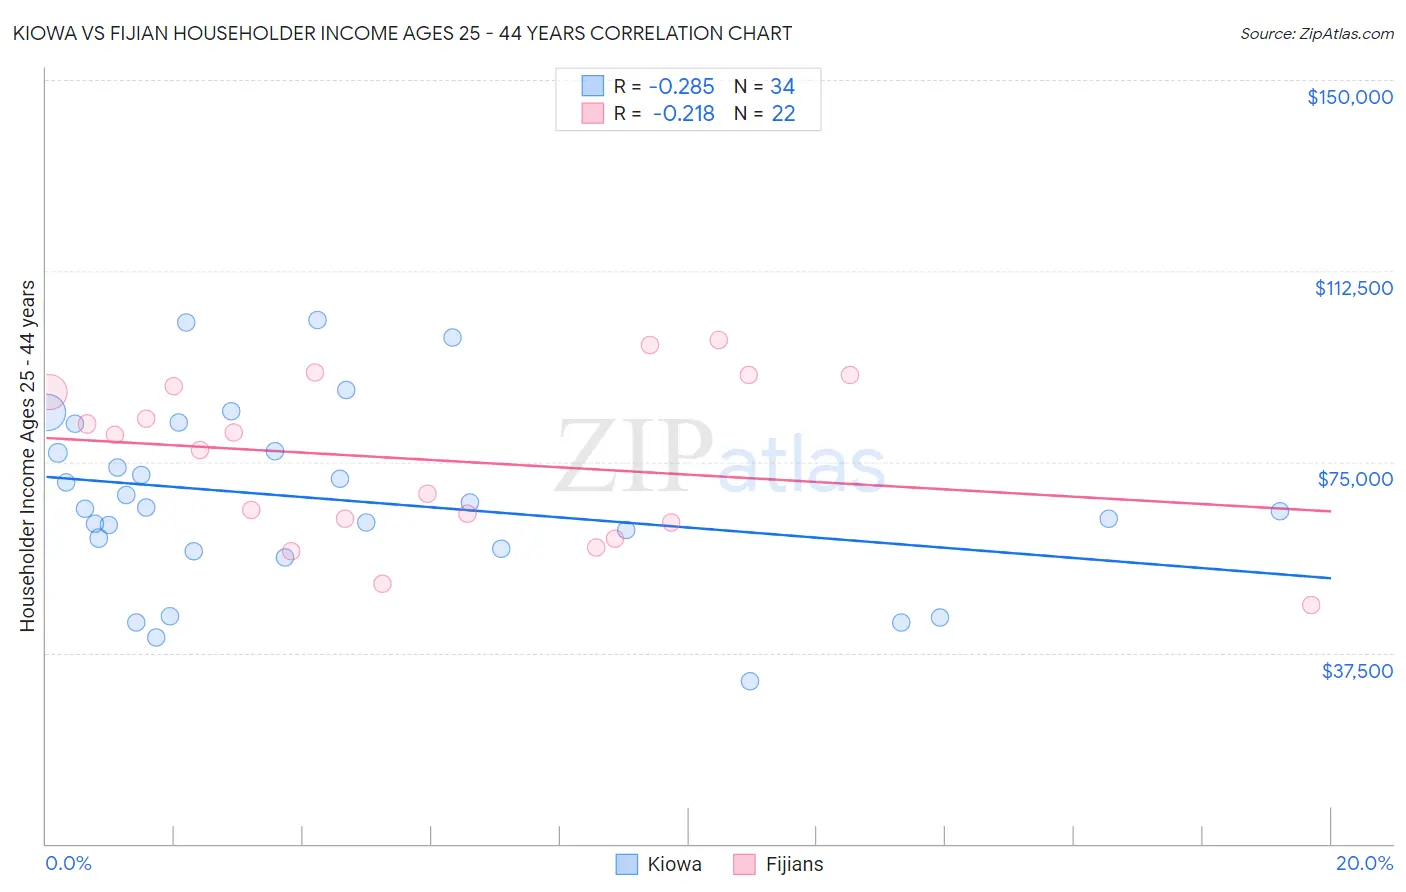
Kiowa vs Fijian Householder Income Ages 25 - 44 years Correlation Chart
The statistical analysis conducted on geographies consisting of 56,084,974 people shows a weak negative correlation between the proportion of Kiowa and household income with householder between the ages 25 and 44 in the United States with a correlation coefficient (R) of -0.285 and weighted average of $74,776. Similarly, the statistical analysis conducted on geographies consisting of 55,935,087 people shows a weak negative correlation between the proportion of Fijians and household income with householder between the ages 25 and 44 in the United States with a correlation coefficient (R) of -0.218 and weighted average of $79,956, a difference of 6.9%.
Householder Income Ages 25 - 44 years Correlation Summary
| Measurement | Kiowa | Fijian |
| Minimum | $31,875 | $46,875 |
| Maximum | $102,750 | $98,958 |
| Range | $70,875 | $52,083 |
| Mean | $67,591 | $75,303 |
| Median | $65,895 | $78,830 |
| Interquartile 25% (IQ1) | $57,875 | $63,125 |
| Interquartile 75% (IQ3) | $77,000 | $89,954 |
| Interquartile Range (IQR) | $19,125 | $26,829 |
| Standard Deviation (Sample) | $17,380 | $15,837 |
| Standard Deviation (Population) | $17,122 | $15,473 |
Similar Demographics by Householder Income Ages 25 - 44 years
Demographics Similar to Kiowa by Householder Income Ages 25 - 44 years
In terms of householder income ages 25 - 44 years, the demographic groups most similar to Kiowa are Creek ($74,847, a difference of 0.10%), Hopi ($75,002, a difference of 0.30%), Bahamian ($75,395, a difference of 0.83%), Native/Alaskan ($75,647, a difference of 1.2%), and Yup'ik ($73,688, a difference of 1.5%).
| Demographics | Rating | Rank | Householder Income Ages 25 - 44 years |
| Immigrants | Cuba | 0.0 /100 | #328 | Tragic $76,701 |
| Seminole | 0.0 /100 | #329 | Tragic $76,584 |
| Yakama | 0.0 /100 | #330 | Tragic $76,226 |
| Natives/Alaskans | 0.0 /100 | #331 | Tragic $75,647 |
| Bahamians | 0.0 /100 | #332 | Tragic $75,395 |
| Hopi | 0.0 /100 | #333 | Tragic $75,002 |
| Creek | 0.0 /100 | #334 | Tragic $74,847 |
| Kiowa | 0.0 /100 | #335 | Tragic $74,776 |
| Yup'ik | 0.0 /100 | #336 | Tragic $73,688 |
| Blacks/African Americans | 0.0 /100 | #337 | Tragic $73,370 |
| Immigrants | Yemen | 0.0 /100 | #338 | Tragic $73,043 |
| Yuman | 0.0 /100 | #339 | Tragic $72,956 |
| Immigrants | Congo | 0.0 /100 | #340 | Tragic $72,178 |
| Arapaho | 0.0 /100 | #341 | Tragic $71,697 |
| Crow | 0.0 /100 | #342 | Tragic $71,337 |
Demographics Similar to Fijians by Householder Income Ages 25 - 44 years
In terms of householder income ages 25 - 44 years, the demographic groups most similar to Fijians are Chippewa ($80,005, a difference of 0.060%), Immigrants from Central America ($80,012, a difference of 0.070%), Haitian ($80,055, a difference of 0.12%), Apache ($80,260, a difference of 0.38%), and Immigrants from Dominican Republic ($80,319, a difference of 0.45%).
| Demographics | Rating | Rank | Householder Income Ages 25 - 44 years |
| Mexicans | 0.0 /100 | #303 | Tragic $80,427 |
| Immigrants | Caribbean | 0.0 /100 | #304 | Tragic $80,326 |
| Immigrants | Dominican Republic | 0.0 /100 | #305 | Tragic $80,319 |
| Apache | 0.0 /100 | #306 | Tragic $80,260 |
| Haitians | 0.0 /100 | #307 | Tragic $80,055 |
| Immigrants | Central America | 0.0 /100 | #308 | Tragic $80,012 |
| Chippewa | 0.0 /100 | #309 | Tragic $80,005 |
| Fijians | 0.0 /100 | #310 | Tragic $79,956 |
| Indonesians | 0.0 /100 | #311 | Tragic $79,543 |
| Immigrants | Haiti | 0.0 /100 | #312 | Tragic $79,391 |
| Menominee | 0.0 /100 | #313 | Tragic $79,358 |
| Cheyenne | 0.0 /100 | #314 | Tragic $79,152 |
| Ottawa | 0.0 /100 | #315 | Tragic $79,012 |
| Africans | 0.0 /100 | #316 | Tragic $78,986 |
| U.S. Virgin Islanders | 0.0 /100 | #317 | Tragic $78,911 |