Kenyan vs Scottish Unemployment Among Youth under 25 years
COMPARE
Kenyan
Scottish
Unemployment Among Youth under 25 years
Unemployment Among Youth under 25 years Comparison
Kenyans
Scottish
11.2%
UNEMPLOYMENT AMONG YOUTH UNDER 25 YEARS
95.7/ 100
METRIC RATING
87th/ 347
METRIC RANK
10.9%
UNEMPLOYMENT AMONG YOUTH UNDER 25 YEARS
99.8/ 100
METRIC RATING
40th/ 347
METRIC RANK
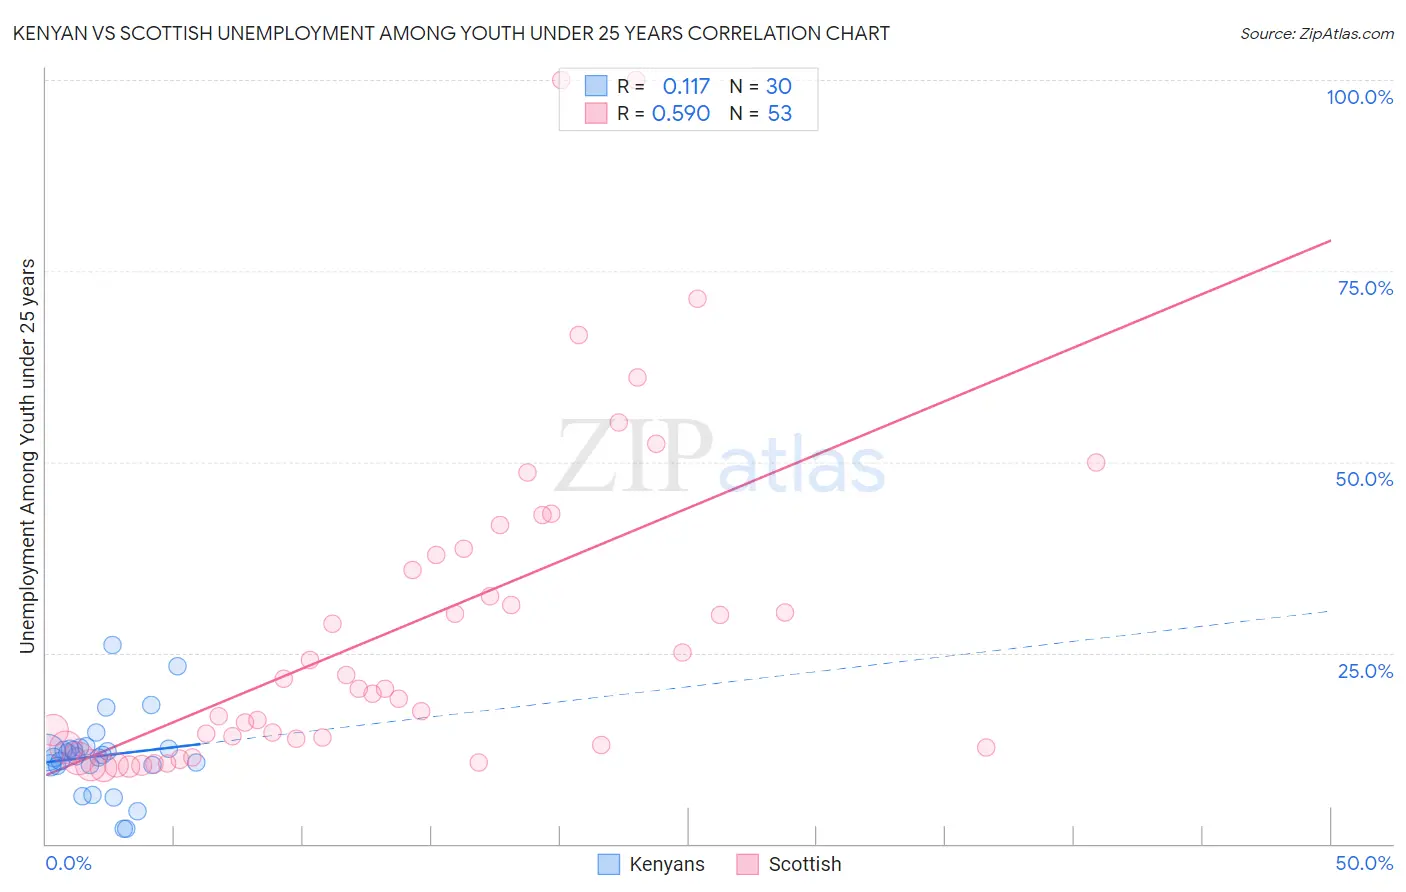
Kenyan vs Scottish Unemployment Among Youth under 25 years Correlation Chart
The statistical analysis conducted on geographies consisting of 167,662,123 people shows a poor positive correlation between the proportion of Kenyans and unemployment rate among youth under the age of 25 in the United States with a correlation coefficient (R) of 0.117 and weighted average of 11.2%. Similarly, the statistical analysis conducted on geographies consisting of 542,532,061 people shows a substantial positive correlation between the proportion of Scottish and unemployment rate among youth under the age of 25 in the United States with a correlation coefficient (R) of 0.590 and weighted average of 10.9%, a difference of 3.3%.
Unemployment Among Youth under 25 years Correlation Summary
| Measurement | Kenyan | Scottish |
| Minimum | 1.9% | 9.9% |
| Maximum | 26.0% | 100.0% |
| Range | 24.1% | 90.1% |
| Mean | 11.5% | 28.4% |
| Median | 11.5% | 20.3% |
| Interquartile 25% (IQ1) | 10.2% | 12.8% |
| Interquartile 75% (IQ3) | 12.5% | 38.2% |
| Interquartile Range (IQR) | 2.2% | 25.5% |
| Standard Deviation (Sample) | 5.2% | 21.5% |
| Standard Deviation (Population) | 5.1% | 21.3% |
Similar Demographics by Unemployment Among Youth under 25 years
Demographics Similar to Kenyans by Unemployment Among Youth under 25 years
In terms of unemployment among youth under 25 years, the demographic groups most similar to Kenyans are Immigrants from South Africa (11.2%, a difference of 0.010%), Immigrants from South Central Asia (11.2%, a difference of 0.040%), French Canadian (11.2%, a difference of 0.050%), Austrian (11.2%, a difference of 0.050%), and Immigrants from Japan (11.2%, a difference of 0.060%).
| Demographics | Rating | Rank | Unemployment Among Youth under 25 years |
| Immigrants | Bulgaria | 96.4 /100 | #80 | Exceptional 11.2% |
| Icelanders | 96.3 /100 | #81 | Exceptional 11.2% |
| Northern Europeans | 96.2 /100 | #82 | Exceptional 11.2% |
| Bolivians | 96.1 /100 | #83 | Exceptional 11.2% |
| French Canadians | 95.9 /100 | #84 | Exceptional 11.2% |
| Immigrants | South Central Asia | 95.9 /100 | #85 | Exceptional 11.2% |
| Immigrants | South Africa | 95.8 /100 | #86 | Exceptional 11.2% |
| Kenyans | 95.7 /100 | #87 | Exceptional 11.2% |
| Austrians | 95.5 /100 | #88 | Exceptional 11.2% |
| Immigrants | Japan | 95.5 /100 | #89 | Exceptional 11.2% |
| Immigrants | Bolivia | 95.5 /100 | #90 | Exceptional 11.2% |
| Immigrants | Taiwan | 95.1 /100 | #91 | Exceptional 11.2% |
| Immigrants | Latvia | 95.1 /100 | #92 | Exceptional 11.2% |
| Immigrants | North America | 95.1 /100 | #93 | Exceptional 11.2% |
| Lithuanians | 94.8 /100 | #94 | Exceptional 11.3% |
Demographics Similar to Scottish by Unemployment Among Youth under 25 years
In terms of unemployment among youth under 25 years, the demographic groups most similar to Scottish are Croatian (10.9%, a difference of 0.10%), Immigrants from Zaire (10.9%, a difference of 0.16%), Immigrants from Congo (10.9%, a difference of 0.17%), Cambodian (10.9%, a difference of 0.17%), and Immigrants from Zimbabwe (10.8%, a difference of 0.24%).
| Demographics | Rating | Rank | Unemployment Among Youth under 25 years |
| Europeans | 99.9 /100 | #33 | Exceptional 10.8% |
| English | 99.9 /100 | #34 | Exceptional 10.8% |
| Immigrants | Nepal | 99.9 /100 | #35 | Exceptional 10.8% |
| Hmong | 99.8 /100 | #36 | Exceptional 10.8% |
| Immigrants | Zimbabwe | 99.8 /100 | #37 | Exceptional 10.8% |
| Immigrants | Congo | 99.8 /100 | #38 | Exceptional 10.9% |
| Immigrants | Zaire | 99.8 /100 | #39 | Exceptional 10.9% |
| Scottish | 99.8 /100 | #40 | Exceptional 10.9% |
| Croatians | 99.8 /100 | #41 | Exceptional 10.9% |
| Cambodians | 99.7 /100 | #42 | Exceptional 10.9% |
| British | 99.7 /100 | #43 | Exceptional 10.9% |
| Welsh | 99.7 /100 | #44 | Exceptional 10.9% |
| Bulgarians | 99.6 /100 | #45 | Exceptional 10.9% |
| Tongans | 99.6 /100 | #46 | Exceptional 10.9% |
| Australians | 99.6 /100 | #47 | Exceptional 10.9% |