Kenyan vs Pueblo Wage/Income Gap
COMPARE
Kenyan
Pueblo
Wage/Income Gap
Wage/Income Gap Comparison
Kenyans
Pueblo
24.5%
WAGE/INCOME GAP
95.8/ 100
METRIC RATING
119th/ 347
METRIC RANK
20.7%
WAGE/INCOME GAP
100.0/ 100
METRIC RATING
26th/ 347
METRIC RANK
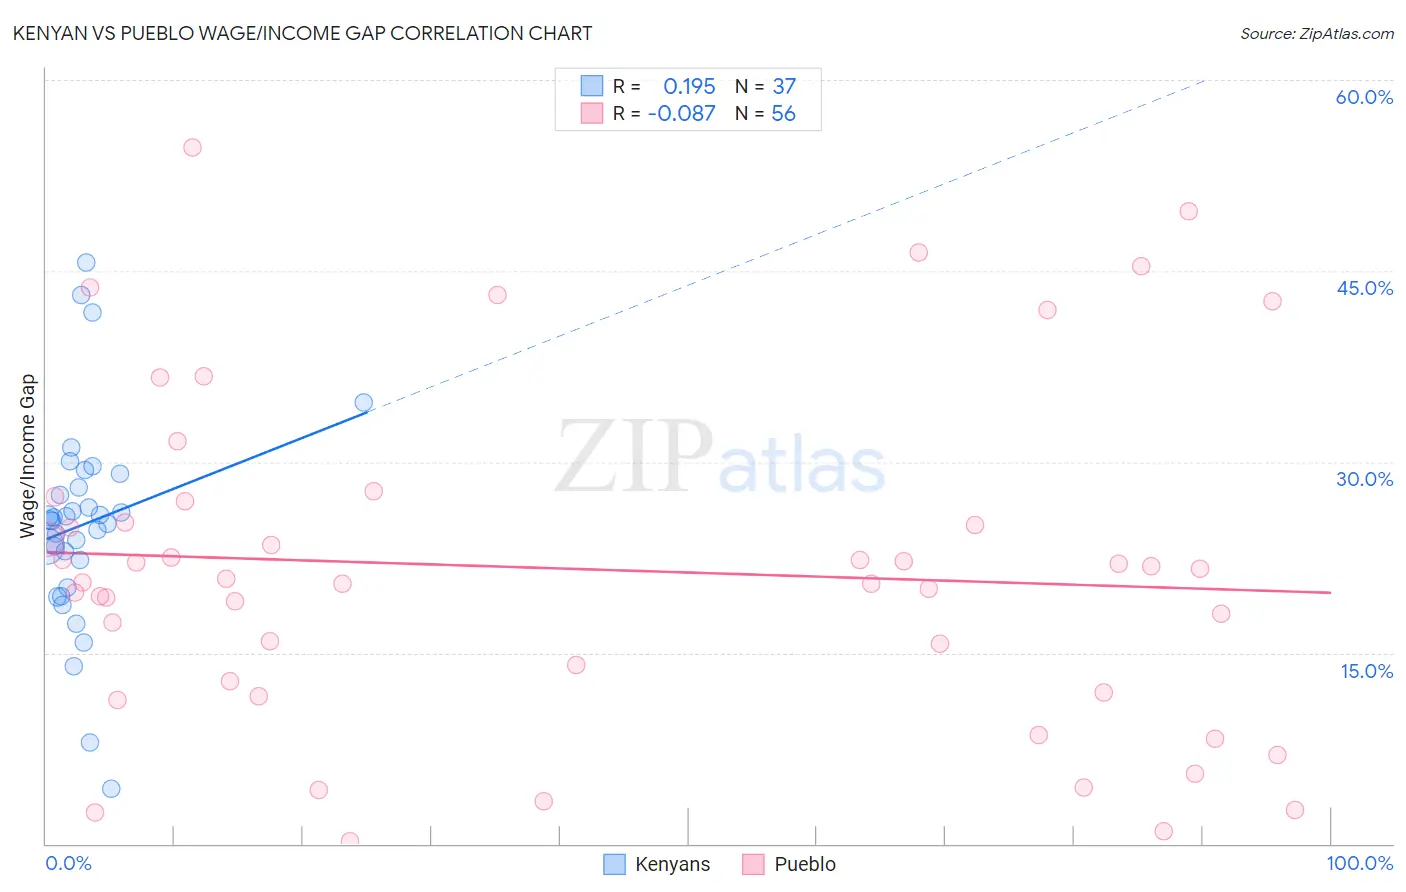
Kenyan vs Pueblo Wage/Income Gap Correlation Chart
The statistical analysis conducted on geographies consisting of 168,231,512 people shows a poor positive correlation between the proportion of Kenyans and wage/income gap percentage in the United States with a correlation coefficient (R) of 0.195 and weighted average of 24.5%. Similarly, the statistical analysis conducted on geographies consisting of 120,015,630 people shows a slight negative correlation between the proportion of Pueblo and wage/income gap percentage in the United States with a correlation coefficient (R) of -0.087 and weighted average of 20.7%, a difference of 18.3%.
Wage/Income Gap Correlation Summary
| Measurement | Kenyan | Pueblo |
| Minimum | 4.3% | 0.15% |
| Maximum | 45.6% | 54.7% |
| Range | 41.3% | 54.5% |
| Mean | 25.1% | 21.6% |
| Median | 25.4% | 20.7% |
| Interquartile 25% (IQ1) | 21.2% | 12.3% |
| Interquartile 75% (IQ3) | 28.5% | 26.1% |
| Interquartile Range (IQR) | 7.3% | 13.8% |
| Standard Deviation (Sample) | 8.2% | 13.1% |
| Standard Deviation (Population) | 8.1% | 13.0% |
Similar Demographics by Wage/Income Gap
Demographics Similar to Kenyans by Wage/Income Gap
In terms of wage/income gap, the demographic groups most similar to Kenyans are Immigrants from Micronesia (24.4%, a difference of 0.020%), Immigrants from Afghanistan (24.4%, a difference of 0.050%), Cree (24.5%, a difference of 0.070%), Alaska Native (24.4%, a difference of 0.11%), and Immigrants from Kenya (24.4%, a difference of 0.28%).
| Demographics | Rating | Rank | Wage/Income Gap |
| Immigrants | Colombia | 97.0 /100 | #112 | Exceptional 24.3% |
| Sioux | 96.9 /100 | #113 | Exceptional 24.3% |
| Panamanians | 96.5 /100 | #114 | Exceptional 24.4% |
| Immigrants | Kenya | 96.4 /100 | #115 | Exceptional 24.4% |
| Alaska Natives | 96.0 /100 | #116 | Exceptional 24.4% |
| Immigrants | Afghanistan | 95.9 /100 | #117 | Exceptional 24.4% |
| Immigrants | Micronesia | 95.8 /100 | #118 | Exceptional 24.4% |
| Kenyans | 95.8 /100 | #119 | Exceptional 24.5% |
| Cree | 95.6 /100 | #120 | Exceptional 24.5% |
| Immigrants | Thailand | 94.9 /100 | #121 | Exceptional 24.5% |
| Apache | 94.8 /100 | #122 | Exceptional 24.5% |
| Natives/Alaskans | 94.6 /100 | #123 | Exceptional 24.6% |
| Immigrants | South America | 93.9 /100 | #124 | Exceptional 24.6% |
| Spanish Americans | 93.8 /100 | #125 | Exceptional 24.6% |
| Immigrants | Uruguay | 93.8 /100 | #126 | Exceptional 24.6% |
Demographics Similar to Pueblo by Wage/Income Gap
In terms of wage/income gap, the demographic groups most similar to Pueblo are Senegalese (20.7%, a difference of 0.11%), Immigrants from Armenia (20.7%, a difference of 0.20%), Dominican (20.6%, a difference of 0.41%), Inupiat (20.8%, a difference of 0.43%), and Immigrants from Dominican Republic (20.6%, a difference of 0.58%).
| Demographics | Rating | Rank | Wage/Income Gap |
| Immigrants | Dominica | 100.0 /100 | #19 | Exceptional 20.0% |
| Bahamians | 100.0 /100 | #20 | Exceptional 20.2% |
| Immigrants | Caribbean | 100.0 /100 | #21 | Exceptional 20.4% |
| Immigrants | Liberia | 100.0 /100 | #22 | Exceptional 20.6% |
| Immigrants | Dominican Republic | 100.0 /100 | #23 | Exceptional 20.6% |
| Dominicans | 100.0 /100 | #24 | Exceptional 20.6% |
| Senegalese | 100.0 /100 | #25 | Exceptional 20.7% |
| Pueblo | 100.0 /100 | #26 | Exceptional 20.7% |
| Immigrants | Armenia | 100.0 /100 | #27 | Exceptional 20.7% |
| Inupiat | 100.0 /100 | #28 | Exceptional 20.8% |
| Immigrants | Senegal | 100.0 /100 | #29 | Exceptional 20.9% |
| Immigrants | Bangladesh | 100.0 /100 | #30 | Exceptional 20.9% |
| Vietnamese | 100.0 /100 | #31 | Exceptional 21.0% |
| Immigrants | Yemen | 100.0 /100 | #32 | Exceptional 21.1% |
| Immigrants | Bahamas | 100.0 /100 | #33 | Exceptional 21.1% |