Paraguayan vs Ukrainian Median Family Income
COMPARE
Paraguayan
Ukrainian
Median Family Income
Median Family Income Comparison
Paraguayans
Ukrainians
$114,016
MEDIAN FAMILY INCOME
99.7/ 100
METRIC RATING
66th/ 347
METRIC RANK
$111,368
MEDIAN FAMILY INCOME
98.8/ 100
METRIC RATING
86th/ 347
METRIC RANK
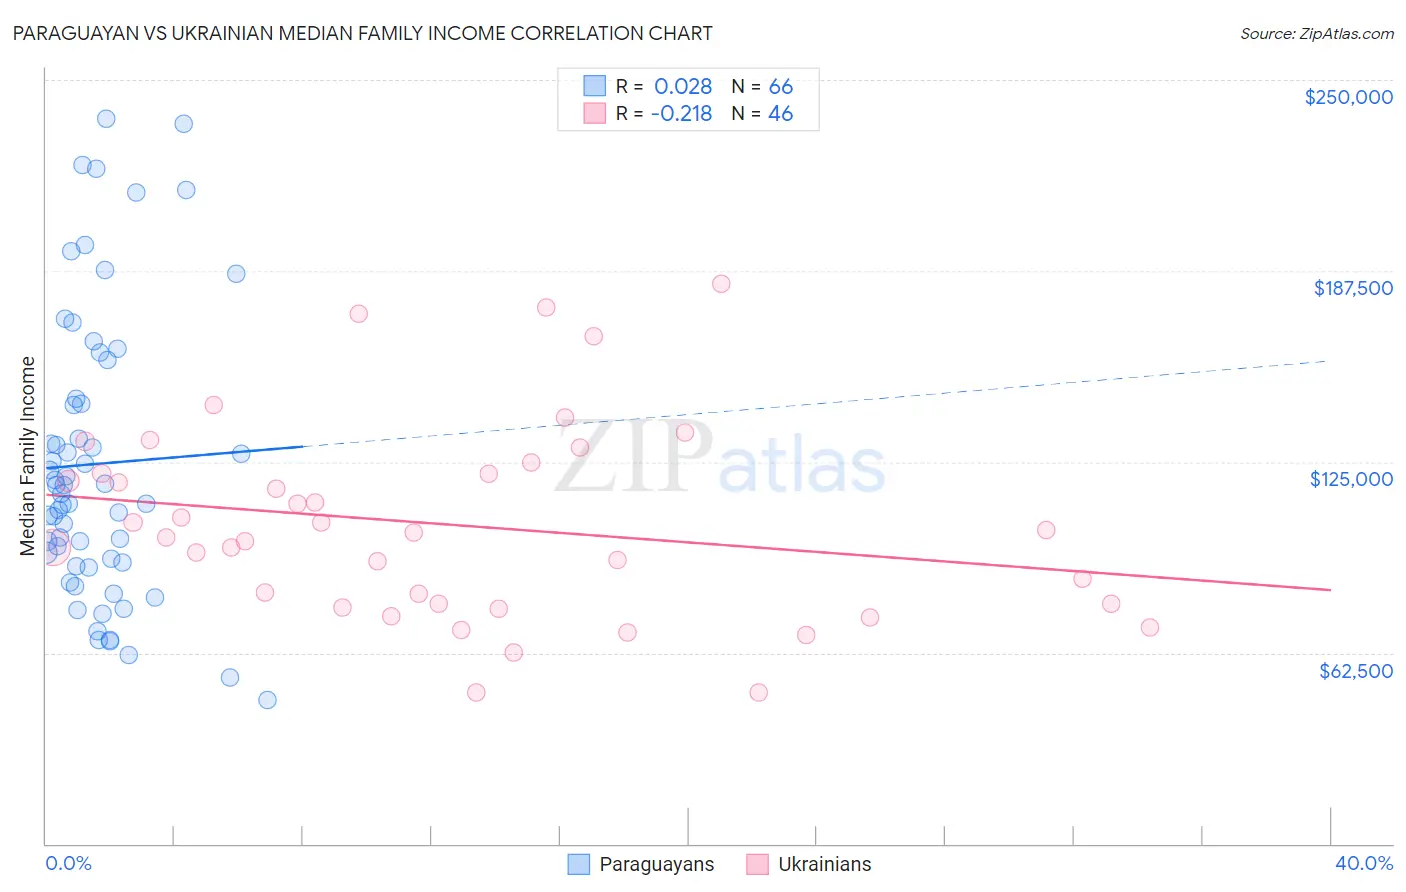
Paraguayan vs Ukrainian Median Family Income Correlation Chart
The statistical analysis conducted on geographies consisting of 95,094,698 people shows no correlation between the proportion of Paraguayans and median family income in the United States with a correlation coefficient (R) of 0.028 and weighted average of $114,016. Similarly, the statistical analysis conducted on geographies consisting of 448,126,657 people shows a weak negative correlation between the proportion of Ukrainians and median family income in the United States with a correlation coefficient (R) of -0.218 and weighted average of $111,368, a difference of 2.4%.
Median Family Income Correlation Summary
| Measurement | Paraguayan | Ukrainian |
| Minimum | $47,188 | $49,418 |
| Maximum | $237,188 | $183,477 |
| Range | $190,000 | $134,059 |
| Mean | $124,379 | $104,354 |
| Median | $115,994 | $101,148 |
| Interquartile 25% (IQ1) | $91,993 | $78,581 |
| Interquartile 75% (IQ3) | $145,560 | $121,262 |
| Interquartile Range (IQR) | $53,567 | $42,681 |
| Standard Deviation (Sample) | $46,622 | $32,156 |
| Standard Deviation (Population) | $46,268 | $31,804 |
Demographics Similar to Paraguayans and Ukrainians by Median Family Income
In terms of median family income, the demographic groups most similar to Paraguayans are Immigrants from Spain ($113,815, a difference of 0.18%), Immigrants from Serbia ($113,463, a difference of 0.49%), Immigrants from Bulgaria ($113,461, a difference of 0.49%), Immigrants from Romania ($113,434, a difference of 0.51%), and South African ($113,229, a difference of 0.70%). Similarly, the demographic groups most similar to Ukrainians are Croatian ($111,370, a difference of 0.0%), Immigrants from Hungary ($111,378, a difference of 0.010%), Immigrants from Egypt ($111,689, a difference of 0.29%), Immigrants from England ($112,038, a difference of 0.60%), and Immigrants from North America ($112,151, a difference of 0.70%).
| Demographics | Rating | Rank | Median Family Income |
| Paraguayans | 99.7 /100 | #66 | Exceptional $114,016 |
| Immigrants | Spain | 99.7 /100 | #67 | Exceptional $113,815 |
| Immigrants | Serbia | 99.6 /100 | #68 | Exceptional $113,463 |
| Immigrants | Bulgaria | 99.6 /100 | #69 | Exceptional $113,461 |
| Immigrants | Romania | 99.6 /100 | #70 | Exceptional $113,434 |
| South Africans | 99.5 /100 | #71 | Exceptional $113,229 |
| Afghans | 99.5 /100 | #72 | Exceptional $112,971 |
| Laotians | 99.5 /100 | #73 | Exceptional $112,859 |
| Immigrants | Italy | 99.4 /100 | #74 | Exceptional $112,848 |
| Immigrants | Western Europe | 99.4 /100 | #75 | Exceptional $112,688 |
| Argentineans | 99.4 /100 | #76 | Exceptional $112,665 |
| Immigrants | Eastern Europe | 99.4 /100 | #77 | Exceptional $112,527 |
| Immigrants | Canada | 99.3 /100 | #78 | Exceptional $112,374 |
| Italians | 99.3 /100 | #79 | Exceptional $112,372 |
| Immigrants | Croatia | 99.3 /100 | #80 | Exceptional $112,323 |
| Immigrants | North America | 99.2 /100 | #81 | Exceptional $112,151 |
| Immigrants | England | 99.2 /100 | #82 | Exceptional $112,038 |
| Immigrants | Egypt | 99.0 /100 | #83 | Exceptional $111,689 |
| Immigrants | Hungary | 98.8 /100 | #84 | Exceptional $111,378 |
| Croatians | 98.8 /100 | #85 | Exceptional $111,370 |
| Ukrainians | 98.8 /100 | #86 | Exceptional $111,368 |