French American Indian vs Eastern European Householder Income Ages 25 - 44 years
COMPARE
French American Indian
Eastern European
Householder Income Ages 25 - 44 years
Householder Income Ages 25 - 44 years Comparison
French American Indians
Eastern Europeans
$85,899
HOUSEHOLDER INCOME AGES 25 - 44 YEARS
0.8/ 100
METRIC RATING
249th/ 347
METRIC RANK
$114,523
HOUSEHOLDER INCOME AGES 25 - 44 YEARS
100.0/ 100
METRIC RATING
18th/ 347
METRIC RANK
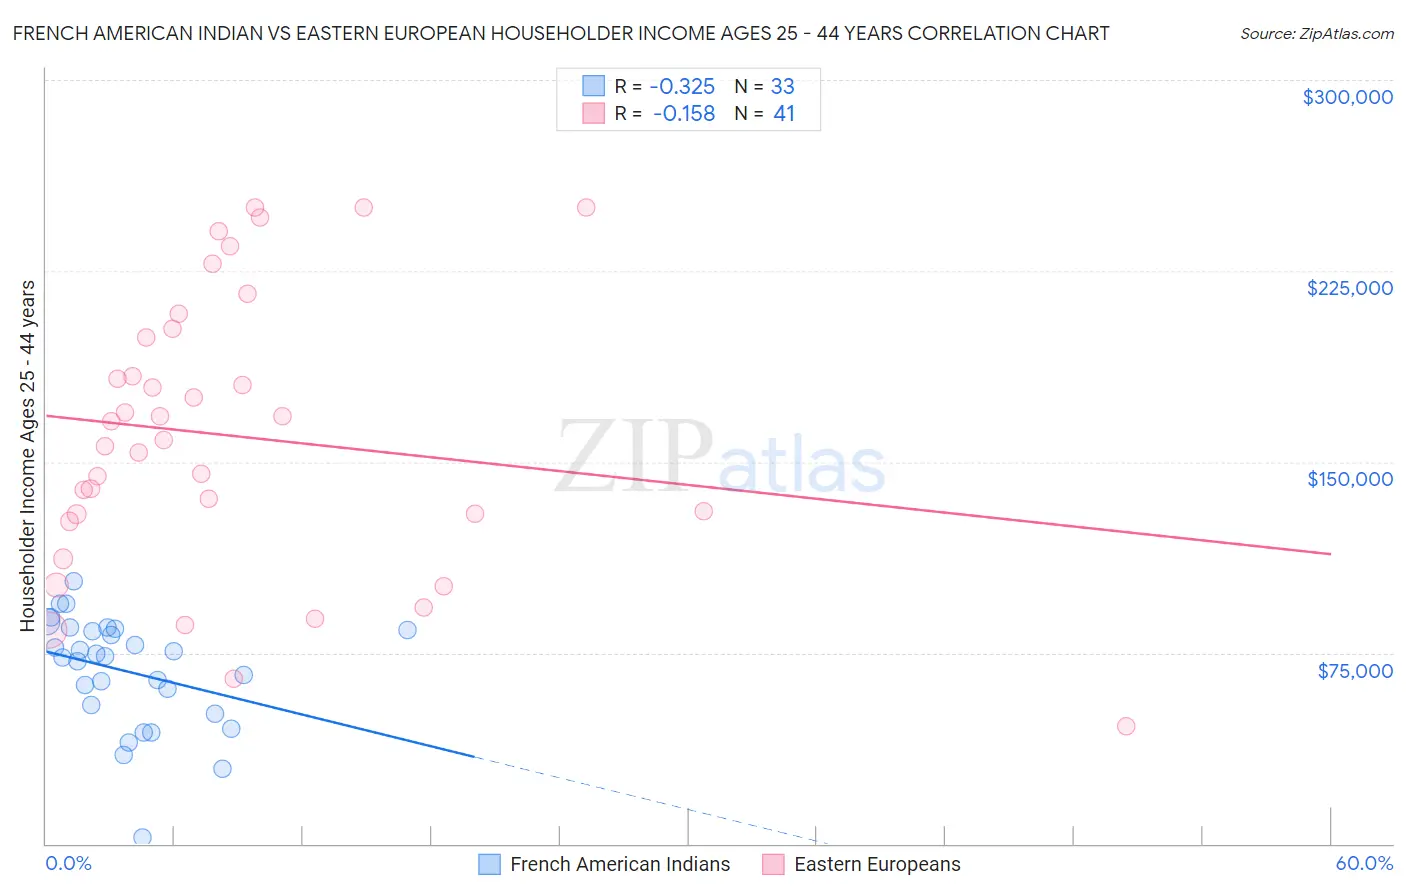
French American Indian vs Eastern European Householder Income Ages 25 - 44 years Correlation Chart
The statistical analysis conducted on geographies consisting of 131,864,542 people shows a mild negative correlation between the proportion of French American Indians and household income with householder between the ages 25 and 44 in the United States with a correlation coefficient (R) of -0.325 and weighted average of $85,899. Similarly, the statistical analysis conducted on geographies consisting of 459,307,576 people shows a poor negative correlation between the proportion of Eastern Europeans and household income with householder between the ages 25 and 44 in the United States with a correlation coefficient (R) of -0.158 and weighted average of $114,523, a difference of 33.3%.
Householder Income Ages 25 - 44 years Correlation Summary
| Measurement | French American Indian | Eastern European |
| Minimum | $2,499 | $46,280 |
| Maximum | $102,898 | $250,001 |
| Range | $100,399 | $203,721 |
| Mean | $67,668 | $160,039 |
| Median | $73,750 | $158,530 |
| Interquartile 25% (IQ1) | $52,805 | $128,065 |
| Interquartile 75% (IQ3) | $84,046 | $200,429 |
| Interquartile Range (IQR) | $31,241 | $72,364 |
| Standard Deviation (Sample) | $21,873 | $54,167 |
| Standard Deviation (Population) | $21,539 | $53,502 |
Similar Demographics by Householder Income Ages 25 - 44 years
Demographics Similar to French American Indians by Householder Income Ages 25 - 44 years
In terms of householder income ages 25 - 44 years, the demographic groups most similar to French American Indians are Pennsylvania German ($85,836, a difference of 0.070%), Cape Verdean ($85,758, a difference of 0.16%), Immigrants from Sudan ($86,109, a difference of 0.24%), Immigrants from Western Africa ($85,676, a difference of 0.26%), and British West Indian ($85,565, a difference of 0.39%).
| Demographics | Rating | Rank | Householder Income Ages 25 - 44 years |
| West Indians | 1.7 /100 | #242 | Tragic $87,205 |
| Immigrants | West Indies | 1.5 /100 | #243 | Tragic $87,063 |
| Immigrants | Venezuela | 1.5 /100 | #244 | Tragic $87,038 |
| Immigrants | El Salvador | 1.4 /100 | #245 | Tragic $86,913 |
| Immigrants | Burma/Myanmar | 1.3 /100 | #246 | Tragic $86,736 |
| Immigrants | Nigeria | 1.2 /100 | #247 | Tragic $86,589 |
| Immigrants | Sudan | 0.9 /100 | #248 | Tragic $86,109 |
| French American Indians | 0.8 /100 | #249 | Tragic $85,899 |
| Pennsylvania Germans | 0.8 /100 | #250 | Tragic $85,836 |
| Cape Verdeans | 0.8 /100 | #251 | Tragic $85,758 |
| Immigrants | Western Africa | 0.7 /100 | #252 | Tragic $85,676 |
| British West Indians | 0.7 /100 | #253 | Tragic $85,565 |
| Immigrants | Laos | 0.7 /100 | #254 | Tragic $85,553 |
| German Russians | 0.6 /100 | #255 | Tragic $85,220 |
| Central Americans | 0.5 /100 | #256 | Tragic $85,144 |
Demographics Similar to Eastern Europeans by Householder Income Ages 25 - 44 years
In terms of householder income ages 25 - 44 years, the demographic groups most similar to Eastern Europeans are Burmese ($113,701, a difference of 0.72%), Immigrants from Korea ($113,401, a difference of 0.99%), Immigrants from Australia ($115,947, a difference of 1.2%), Cypriot ($116,364, a difference of 1.6%), and Asian ($112,666, a difference of 1.7%).
| Demographics | Rating | Rank | Householder Income Ages 25 - 44 years |
| Okinawans | 100.0 /100 | #11 | Exceptional $119,349 |
| Immigrants | Iran | 100.0 /100 | #12 | Exceptional $119,204 |
| Immigrants | Eastern Asia | 100.0 /100 | #13 | Exceptional $118,056 |
| Immigrants | Israel | 100.0 /100 | #14 | Exceptional $117,219 |
| Immigrants | South Central Asia | 100.0 /100 | #15 | Exceptional $116,626 |
| Cypriots | 100.0 /100 | #16 | Exceptional $116,364 |
| Immigrants | Australia | 100.0 /100 | #17 | Exceptional $115,947 |
| Eastern Europeans | 100.0 /100 | #18 | Exceptional $114,523 |
| Burmese | 100.0 /100 | #19 | Exceptional $113,701 |
| Immigrants | Korea | 100.0 /100 | #20 | Exceptional $113,401 |
| Asians | 100.0 /100 | #21 | Exceptional $112,666 |
| Immigrants | Belgium | 100.0 /100 | #22 | Exceptional $112,575 |
| Immigrants | Japan | 100.0 /100 | #23 | Exceptional $112,228 |
| Immigrants | Sweden | 100.0 /100 | #24 | Exceptional $112,010 |
| Immigrants | Northern Europe | 100.0 /100 | #25 | Exceptional $111,676 |