Guyanese vs Eastern European Householder Income Ages 25 - 44 years
COMPARE
Guyanese
Eastern European
Householder Income Ages 25 - 44 years
Householder Income Ages 25 - 44 years Comparison
Guyanese
Eastern Europeans
$89,940
HOUSEHOLDER INCOME AGES 25 - 44 YEARS
7.1/ 100
METRIC RATING
218th/ 347
METRIC RANK
$114,523
HOUSEHOLDER INCOME AGES 25 - 44 YEARS
100.0/ 100
METRIC RATING
18th/ 347
METRIC RANK
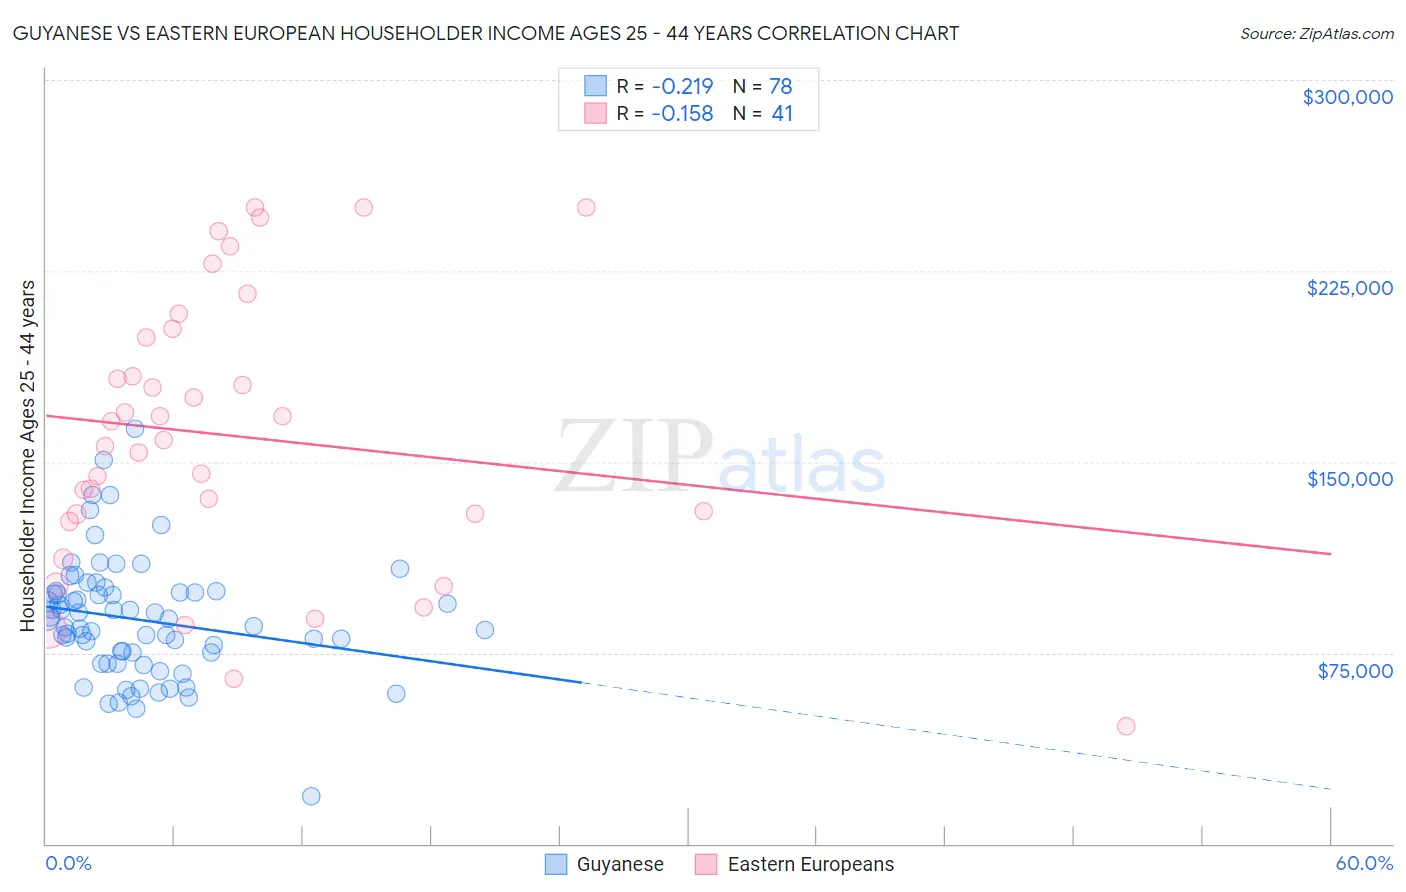
Guyanese vs Eastern European Householder Income Ages 25 - 44 years Correlation Chart
The statistical analysis conducted on geographies consisting of 176,637,436 people shows a weak negative correlation between the proportion of Guyanese and household income with householder between the ages 25 and 44 in the United States with a correlation coefficient (R) of -0.219 and weighted average of $89,940. Similarly, the statistical analysis conducted on geographies consisting of 459,307,576 people shows a poor negative correlation between the proportion of Eastern Europeans and household income with householder between the ages 25 and 44 in the United States with a correlation coefficient (R) of -0.158 and weighted average of $114,523, a difference of 27.3%.
Householder Income Ages 25 - 44 years Correlation Summary
| Measurement | Guyanese | Eastern European |
| Minimum | $18,657 | $46,280 |
| Maximum | $163,166 | $250,001 |
| Range | $144,509 | $203,721 |
| Mean | $87,951 | $160,039 |
| Median | $86,958 | $158,530 |
| Interquartile 25% (IQ1) | $75,027 | $128,065 |
| Interquartile 75% (IQ3) | $98,879 | $200,429 |
| Interquartile Range (IQR) | $23,852 | $72,364 |
| Standard Deviation (Sample) | $23,398 | $54,167 |
| Standard Deviation (Population) | $23,248 | $53,502 |
Similar Demographics by Householder Income Ages 25 - 44 years
Demographics Similar to Guyanese by Householder Income Ages 25 - 44 years
In terms of householder income ages 25 - 44 years, the demographic groups most similar to Guyanese are Scotch-Irish ($89,969, a difference of 0.030%), Delaware ($89,876, a difference of 0.070%), Trinidadian and Tobagonian ($89,856, a difference of 0.090%), Immigrants from Trinidad and Tobago ($89,748, a difference of 0.21%), and Ghanaian ($90,137, a difference of 0.22%).
| Demographics | Rating | Rank | Householder Income Ages 25 - 44 years |
| Iraqis | 10.8 /100 | #211 | Poor $90,764 |
| Hawaiians | 10.6 /100 | #212 | Poor $90,722 |
| Immigrants | Bangladesh | 9.3 /100 | #213 | Tragic $90,448 |
| Immigrants | Africa | 8.9 /100 | #214 | Tragic $90,372 |
| Panamanians | 8.1 /100 | #215 | Tragic $90,193 |
| Ghanaians | 7.9 /100 | #216 | Tragic $90,137 |
| Scotch-Irish | 7.3 /100 | #217 | Tragic $89,969 |
| Guyanese | 7.1 /100 | #218 | Tragic $89,940 |
| Delaware | 6.9 /100 | #219 | Tragic $89,876 |
| Trinidadians and Tobagonians | 6.8 /100 | #220 | Tragic $89,856 |
| Immigrants | Trinidad and Tobago | 6.5 /100 | #221 | Tragic $89,748 |
| Immigrants | Ecuador | 6.2 /100 | #222 | Tragic $89,673 |
| Immigrants | Guyana | 5.9 /100 | #223 | Tragic $89,586 |
| Barbadians | 5.9 /100 | #224 | Tragic $89,565 |
| Immigrants | Panama | 5.5 /100 | #225 | Tragic $89,451 |
Demographics Similar to Eastern Europeans by Householder Income Ages 25 - 44 years
In terms of householder income ages 25 - 44 years, the demographic groups most similar to Eastern Europeans are Burmese ($113,701, a difference of 0.72%), Immigrants from Korea ($113,401, a difference of 0.99%), Immigrants from Australia ($115,947, a difference of 1.2%), Cypriot ($116,364, a difference of 1.6%), and Asian ($112,666, a difference of 1.7%).
| Demographics | Rating | Rank | Householder Income Ages 25 - 44 years |
| Okinawans | 100.0 /100 | #11 | Exceptional $119,349 |
| Immigrants | Iran | 100.0 /100 | #12 | Exceptional $119,204 |
| Immigrants | Eastern Asia | 100.0 /100 | #13 | Exceptional $118,056 |
| Immigrants | Israel | 100.0 /100 | #14 | Exceptional $117,219 |
| Immigrants | South Central Asia | 100.0 /100 | #15 | Exceptional $116,626 |
| Cypriots | 100.0 /100 | #16 | Exceptional $116,364 |
| Immigrants | Australia | 100.0 /100 | #17 | Exceptional $115,947 |
| Eastern Europeans | 100.0 /100 | #18 | Exceptional $114,523 |
| Burmese | 100.0 /100 | #19 | Exceptional $113,701 |
| Immigrants | Korea | 100.0 /100 | #20 | Exceptional $113,401 |
| Asians | 100.0 /100 | #21 | Exceptional $112,666 |
| Immigrants | Belgium | 100.0 /100 | #22 | Exceptional $112,575 |
| Immigrants | Japan | 100.0 /100 | #23 | Exceptional $112,228 |
| Immigrants | Sweden | 100.0 /100 | #24 | Exceptional $112,010 |
| Immigrants | Northern Europe | 100.0 /100 | #25 | Exceptional $111,676 |