Italian vs Immigrants from Kuwait Householder Income Ages 25 - 44 years
COMPARE
Italian
Immigrants from Kuwait
Householder Income Ages 25 - 44 years
Householder Income Ages 25 - 44 years Comparison
Italians
Immigrants from Kuwait
$104,215
HOUSEHOLDER INCOME AGES 25 - 44 YEARS
99.5/ 100
METRIC RATING
73rd/ 347
METRIC RANK
$98,122
HOUSEHOLDER INCOME AGES 25 - 44 YEARS
87.8/ 100
METRIC RATING
130th/ 347
METRIC RANK
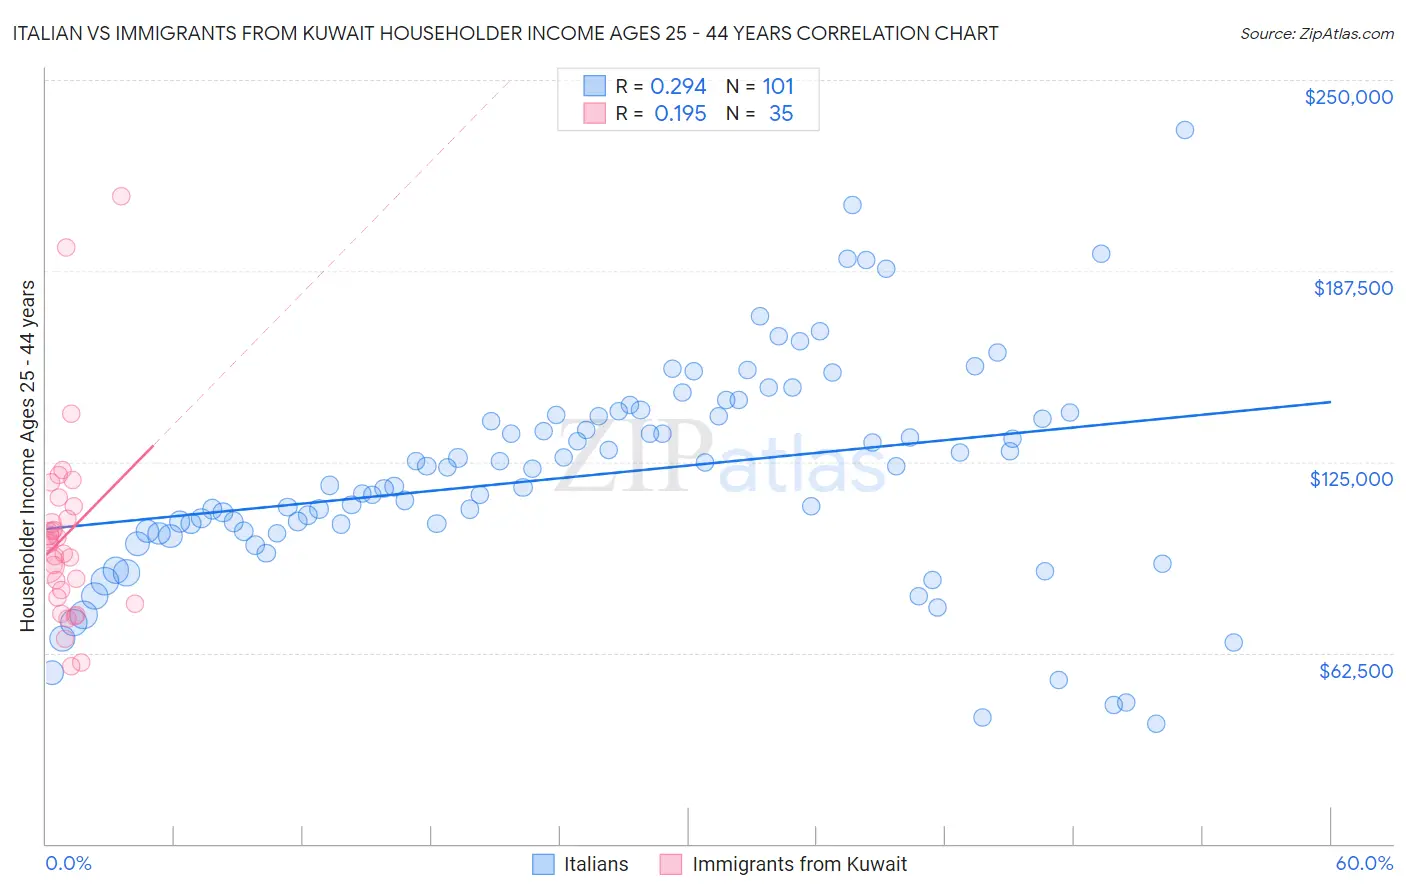
Italian vs Immigrants from Kuwait Householder Income Ages 25 - 44 years Correlation Chart
The statistical analysis conducted on geographies consisting of 568,883,722 people shows a weak positive correlation between the proportion of Italians and household income with householder between the ages 25 and 44 in the United States with a correlation coefficient (R) of 0.294 and weighted average of $104,215. Similarly, the statistical analysis conducted on geographies consisting of 136,849,136 people shows a poor positive correlation between the proportion of Immigrants from Kuwait and household income with householder between the ages 25 and 44 in the United States with a correlation coefficient (R) of 0.195 and weighted average of $98,122, a difference of 6.2%.
Householder Income Ages 25 - 44 years Correlation Summary
| Measurement | Italian | Immigrants from Kuwait |
| Minimum | $39,167 | $58,000 |
| Maximum | $233,533 | $211,833 |
| Range | $194,366 | $153,833 |
| Mean | $120,730 | $100,890 |
| Median | $122,854 | $98,273 |
| Interquartile 25% (IQ1) | $102,018 | $80,635 |
| Interquartile 75% (IQ3) | $140,706 | $110,365 |
| Interquartile Range (IQR) | $38,688 | $29,730 |
| Standard Deviation (Sample) | $35,574 | $31,630 |
| Standard Deviation (Population) | $35,397 | $31,175 |
Similar Demographics by Householder Income Ages 25 - 44 years
Demographics Similar to Italians by Householder Income Ages 25 - 44 years
In terms of householder income ages 25 - 44 years, the demographic groups most similar to Italians are Chinese ($104,264, a difference of 0.050%), Afghan ($104,410, a difference of 0.19%), Immigrants from Fiji ($103,954, a difference of 0.25%), Immigrants from Croatia ($104,503, a difference of 0.28%), and Mongolian ($104,578, a difference of 0.35%).
| Demographics | Rating | Rank | Householder Income Ages 25 - 44 years |
| Laotians | 99.7 /100 | #66 | Exceptional $104,993 |
| Immigrants | Romania | 99.6 /100 | #67 | Exceptional $104,713 |
| Immigrants | Eastern Europe | 99.6 /100 | #68 | Exceptional $104,662 |
| Mongolians | 99.6 /100 | #69 | Exceptional $104,578 |
| Immigrants | Croatia | 99.6 /100 | #70 | Exceptional $104,503 |
| Afghans | 99.6 /100 | #71 | Exceptional $104,410 |
| Chinese | 99.5 /100 | #72 | Exceptional $104,264 |
| Italians | 99.5 /100 | #73 | Exceptional $104,215 |
| Immigrants | Fiji | 99.5 /100 | #74 | Exceptional $103,954 |
| Koreans | 99.4 /100 | #75 | Exceptional $103,824 |
| Immigrants | Spain | 99.4 /100 | #76 | Exceptional $103,752 |
| Immigrants | Southern Europe | 99.3 /100 | #77 | Exceptional $103,486 |
| Immigrants | Bulgaria | 99.3 /100 | #78 | Exceptional $103,423 |
| Armenians | 99.2 /100 | #79 | Exceptional $103,248 |
| Immigrants | Egypt | 99.2 /100 | #80 | Exceptional $103,192 |
Demographics Similar to Immigrants from Kuwait by Householder Income Ages 25 - 44 years
In terms of householder income ages 25 - 44 years, the demographic groups most similar to Immigrants from Kuwait are Brazilian ($98,267, a difference of 0.15%), European ($98,310, a difference of 0.19%), Serbian ($98,320, a difference of 0.20%), Immigrants from Albania ($97,929, a difference of 0.20%), and British ($98,359, a difference of 0.24%).
| Demographics | Rating | Rank | Householder Income Ages 25 - 44 years |
| Palestinians | 91.2 /100 | #123 | Exceptional $98,777 |
| Zimbabweans | 90.3 /100 | #124 | Exceptional $98,586 |
| Pakistanis | 89.3 /100 | #125 | Excellent $98,401 |
| British | 89.1 /100 | #126 | Excellent $98,359 |
| Serbians | 88.9 /100 | #127 | Excellent $98,320 |
| Europeans | 88.9 /100 | #128 | Excellent $98,310 |
| Brazilians | 88.6 /100 | #129 | Excellent $98,267 |
| Immigrants | Kuwait | 87.8 /100 | #130 | Excellent $98,122 |
| Immigrants | Albania | 86.6 /100 | #131 | Excellent $97,929 |
| Immigrants | Zimbabwe | 86.3 /100 | #132 | Excellent $97,880 |
| Tsimshian | 85.8 /100 | #133 | Excellent $97,809 |
| Canadians | 84.5 /100 | #134 | Excellent $97,625 |
| Immigrants | Oceania | 84.5 /100 | #135 | Excellent $97,623 |
| Hungarians | 83.9 /100 | #136 | Excellent $97,544 |
| Lebanese | 82.3 /100 | #137 | Excellent $97,339 |