Italian vs Trinidadian and Tobagonian Householder Income Ages 25 - 44 years
COMPARE
Italian
Trinidadian and Tobagonian
Householder Income Ages 25 - 44 years
Householder Income Ages 25 - 44 years Comparison
Italians
Trinidadians and Tobagonians
$104,215
HOUSEHOLDER INCOME AGES 25 - 44 YEARS
99.5/ 100
METRIC RATING
73rd/ 347
METRIC RANK
$89,856
HOUSEHOLDER INCOME AGES 25 - 44 YEARS
6.8/ 100
METRIC RATING
220th/ 347
METRIC RANK
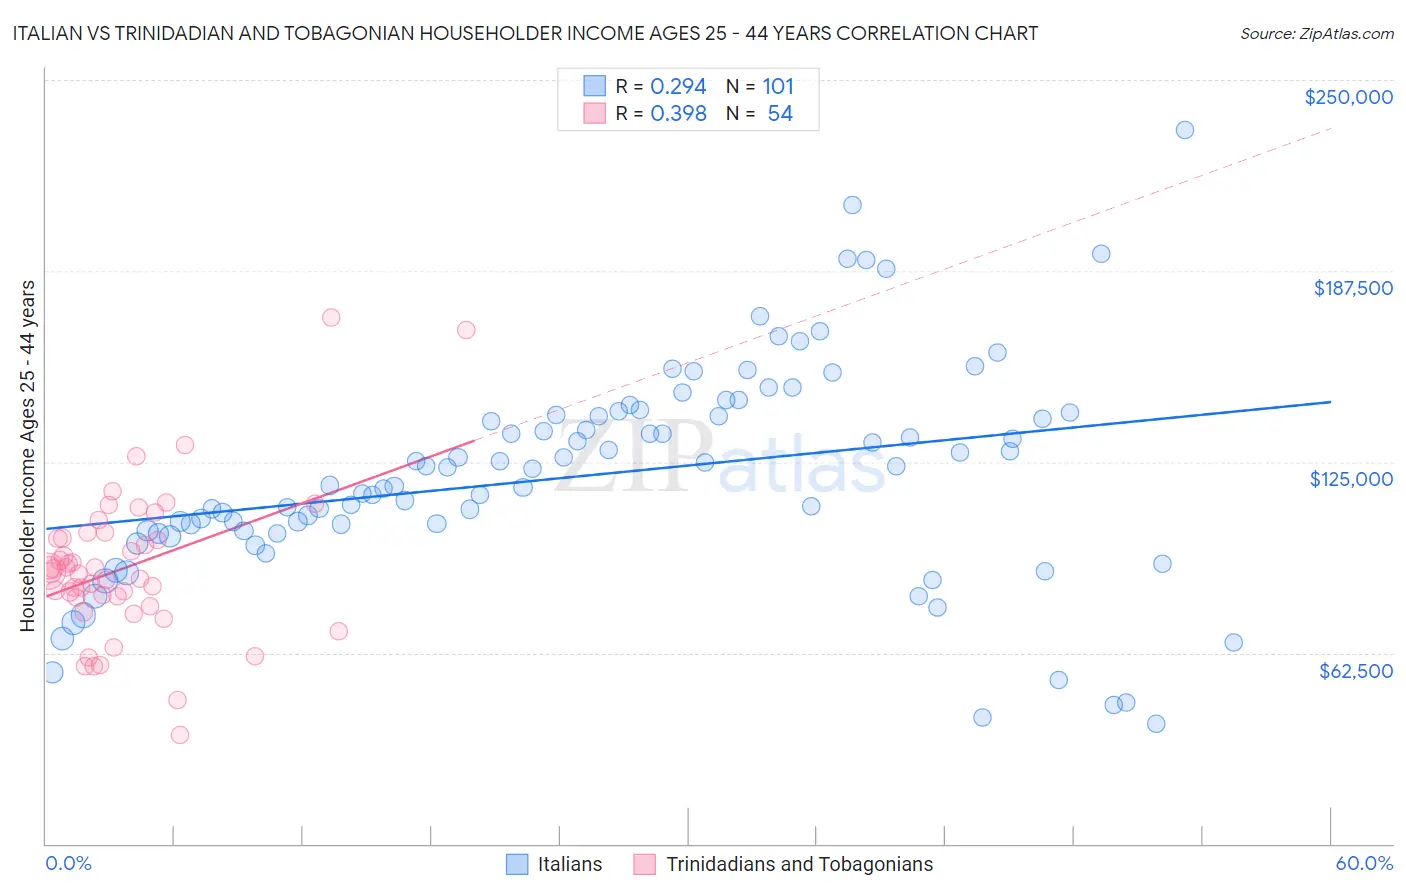
Italian vs Trinidadian and Tobagonian Householder Income Ages 25 - 44 years Correlation Chart
The statistical analysis conducted on geographies consisting of 568,883,722 people shows a weak positive correlation between the proportion of Italians and household income with householder between the ages 25 and 44 in the United States with a correlation coefficient (R) of 0.294 and weighted average of $104,215. Similarly, the statistical analysis conducted on geographies consisting of 219,529,863 people shows a mild positive correlation between the proportion of Trinidadians and Tobagonians and household income with householder between the ages 25 and 44 in the United States with a correlation coefficient (R) of 0.398 and weighted average of $89,856, a difference of 16.0%.
Householder Income Ages 25 - 44 years Correlation Summary
| Measurement | Italian | Trinidadian and Tobagonian |
| Minimum | $39,167 | $35,714 |
| Maximum | $233,533 | $172,171 |
| Range | $194,366 | $136,457 |
| Mean | $120,730 | $90,466 |
| Median | $122,854 | $88,984 |
| Interquartile 25% (IQ1) | $102,018 | $80,428 |
| Interquartile 75% (IQ3) | $140,706 | $100,047 |
| Interquartile Range (IQR) | $38,688 | $19,619 |
| Standard Deviation (Sample) | $35,574 | $24,416 |
| Standard Deviation (Population) | $35,397 | $24,189 |
Similar Demographics by Householder Income Ages 25 - 44 years
Demographics Similar to Italians by Householder Income Ages 25 - 44 years
In terms of householder income ages 25 - 44 years, the demographic groups most similar to Italians are Chinese ($104,264, a difference of 0.050%), Afghan ($104,410, a difference of 0.19%), Immigrants from Fiji ($103,954, a difference of 0.25%), Immigrants from Croatia ($104,503, a difference of 0.28%), and Mongolian ($104,578, a difference of 0.35%).
| Demographics | Rating | Rank | Householder Income Ages 25 - 44 years |
| Laotians | 99.7 /100 | #66 | Exceptional $104,993 |
| Immigrants | Romania | 99.6 /100 | #67 | Exceptional $104,713 |
| Immigrants | Eastern Europe | 99.6 /100 | #68 | Exceptional $104,662 |
| Mongolians | 99.6 /100 | #69 | Exceptional $104,578 |
| Immigrants | Croatia | 99.6 /100 | #70 | Exceptional $104,503 |
| Afghans | 99.6 /100 | #71 | Exceptional $104,410 |
| Chinese | 99.5 /100 | #72 | Exceptional $104,264 |
| Italians | 99.5 /100 | #73 | Exceptional $104,215 |
| Immigrants | Fiji | 99.5 /100 | #74 | Exceptional $103,954 |
| Koreans | 99.4 /100 | #75 | Exceptional $103,824 |
| Immigrants | Spain | 99.4 /100 | #76 | Exceptional $103,752 |
| Immigrants | Southern Europe | 99.3 /100 | #77 | Exceptional $103,486 |
| Immigrants | Bulgaria | 99.3 /100 | #78 | Exceptional $103,423 |
| Armenians | 99.2 /100 | #79 | Exceptional $103,248 |
| Immigrants | Egypt | 99.2 /100 | #80 | Exceptional $103,192 |
Demographics Similar to Trinidadians and Tobagonians by Householder Income Ages 25 - 44 years
In terms of householder income ages 25 - 44 years, the demographic groups most similar to Trinidadians and Tobagonians are Delaware ($89,876, a difference of 0.020%), Guyanese ($89,940, a difference of 0.090%), Immigrants from Trinidad and Tobago ($89,748, a difference of 0.12%), Scotch-Irish ($89,969, a difference of 0.13%), and Immigrants from Ecuador ($89,673, a difference of 0.20%).
| Demographics | Rating | Rank | Householder Income Ages 25 - 44 years |
| Immigrants | Bangladesh | 9.3 /100 | #213 | Tragic $90,448 |
| Immigrants | Africa | 8.9 /100 | #214 | Tragic $90,372 |
| Panamanians | 8.1 /100 | #215 | Tragic $90,193 |
| Ghanaians | 7.9 /100 | #216 | Tragic $90,137 |
| Scotch-Irish | 7.3 /100 | #217 | Tragic $89,969 |
| Guyanese | 7.1 /100 | #218 | Tragic $89,940 |
| Delaware | 6.9 /100 | #219 | Tragic $89,876 |
| Trinidadians and Tobagonians | 6.8 /100 | #220 | Tragic $89,856 |
| Immigrants | Trinidad and Tobago | 6.5 /100 | #221 | Tragic $89,748 |
| Immigrants | Ecuador | 6.2 /100 | #222 | Tragic $89,673 |
| Immigrants | Guyana | 5.9 /100 | #223 | Tragic $89,586 |
| Barbadians | 5.9 /100 | #224 | Tragic $89,565 |
| Immigrants | Panama | 5.5 /100 | #225 | Tragic $89,451 |
| Immigrants | Iraq | 5.5 /100 | #226 | Tragic $89,444 |
| Immigrants | St. Vincent and the Grenadines | 4.1 /100 | #227 | Tragic $88,888 |