Somali vs Immigrants from Kuwait Householder Income Ages 25 - 44 years
COMPARE
Somali
Immigrants from Kuwait
Householder Income Ages 25 - 44 years
Householder Income Ages 25 - 44 years Comparison
Somalis
Immigrants from Kuwait
$83,752
HOUSEHOLDER INCOME AGES 25 - 44 YEARS
0.2/ 100
METRIC RATING
271st/ 347
METRIC RANK
$98,122
HOUSEHOLDER INCOME AGES 25 - 44 YEARS
87.8/ 100
METRIC RATING
130th/ 347
METRIC RANK
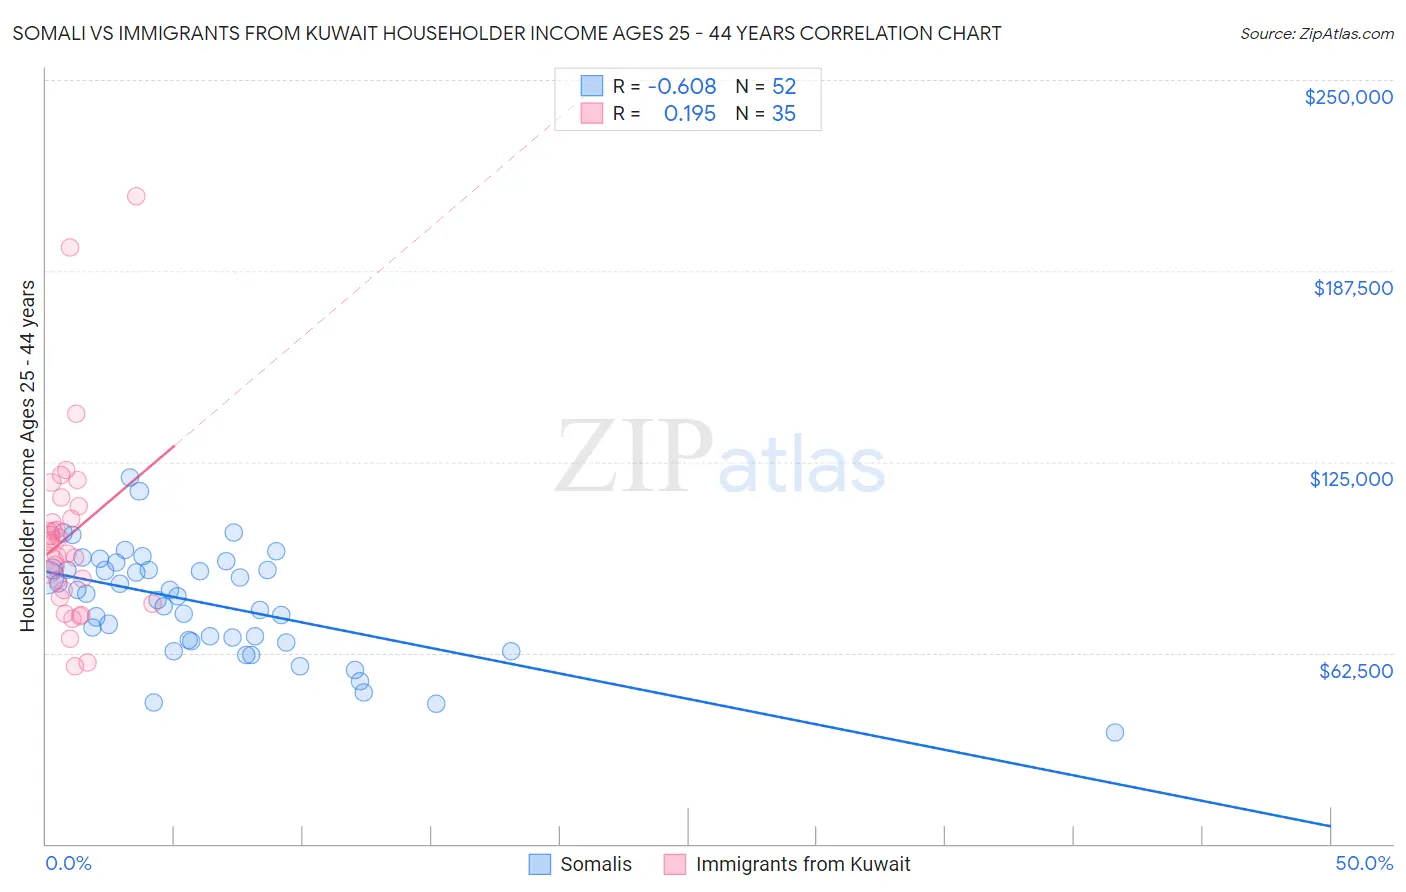
Somali vs Immigrants from Kuwait Householder Income Ages 25 - 44 years Correlation Chart
The statistical analysis conducted on geographies consisting of 99,259,991 people shows a significant negative correlation between the proportion of Somalis and household income with householder between the ages 25 and 44 in the United States with a correlation coefficient (R) of -0.608 and weighted average of $83,752. Similarly, the statistical analysis conducted on geographies consisting of 136,849,136 people shows a poor positive correlation between the proportion of Immigrants from Kuwait and household income with householder between the ages 25 and 44 in the United States with a correlation coefficient (R) of 0.195 and weighted average of $98,122, a difference of 17.2%.
Householder Income Ages 25 - 44 years Correlation Summary
| Measurement | Somali | Immigrants from Kuwait |
| Minimum | $36,409 | $58,000 |
| Maximum | $119,737 | $211,833 |
| Range | $83,328 | $153,833 |
| Mean | $78,789 | $100,890 |
| Median | $81,501 | $98,273 |
| Interquartile 25% (IQ1) | $66,569 | $80,635 |
| Interquartile 75% (IQ3) | $89,819 | $110,365 |
| Interquartile Range (IQR) | $23,250 | $29,730 |
| Standard Deviation (Sample) | $17,508 | $31,630 |
| Standard Deviation (Population) | $17,339 | $31,175 |
Similar Demographics by Householder Income Ages 25 - 44 years
Demographics Similar to Somalis by Householder Income Ages 25 - 44 years
In terms of householder income ages 25 - 44 years, the demographic groups most similar to Somalis are Spanish American ($83,722, a difference of 0.040%), Iroquois ($83,682, a difference of 0.080%), Marshallese ($83,575, a difference of 0.21%), Jamaican ($83,933, a difference of 0.22%), and Spanish American Indian ($84,085, a difference of 0.40%).
| Demographics | Rating | Rank | Householder Income Ages 25 - 44 years |
| Osage | 0.4 /100 | #264 | Tragic $84,461 |
| Sudanese | 0.4 /100 | #265 | Tragic $84,401 |
| Immigrants | Cabo Verde | 0.3 /100 | #266 | Tragic $84,304 |
| Hmong | 0.3 /100 | #267 | Tragic $84,258 |
| Sub-Saharan Africans | 0.3 /100 | #268 | Tragic $84,235 |
| Spanish American Indians | 0.3 /100 | #269 | Tragic $84,085 |
| Jamaicans | 0.3 /100 | #270 | Tragic $83,933 |
| Somalis | 0.2 /100 | #271 | Tragic $83,752 |
| Spanish Americans | 0.2 /100 | #272 | Tragic $83,722 |
| Iroquois | 0.2 /100 | #273 | Tragic $83,682 |
| Marshallese | 0.2 /100 | #274 | Tragic $83,575 |
| Immigrants | Jamaica | 0.2 /100 | #275 | Tragic $83,298 |
| Immigrants | Belize | 0.2 /100 | #276 | Tragic $83,141 |
| Paiute | 0.2 /100 | #277 | Tragic $82,984 |
| Senegalese | 0.2 /100 | #278 | Tragic $82,852 |
Demographics Similar to Immigrants from Kuwait by Householder Income Ages 25 - 44 years
In terms of householder income ages 25 - 44 years, the demographic groups most similar to Immigrants from Kuwait are Brazilian ($98,267, a difference of 0.15%), European ($98,310, a difference of 0.19%), Serbian ($98,320, a difference of 0.20%), Immigrants from Albania ($97,929, a difference of 0.20%), and British ($98,359, a difference of 0.24%).
| Demographics | Rating | Rank | Householder Income Ages 25 - 44 years |
| Palestinians | 91.2 /100 | #123 | Exceptional $98,777 |
| Zimbabweans | 90.3 /100 | #124 | Exceptional $98,586 |
| Pakistanis | 89.3 /100 | #125 | Excellent $98,401 |
| British | 89.1 /100 | #126 | Excellent $98,359 |
| Serbians | 88.9 /100 | #127 | Excellent $98,320 |
| Europeans | 88.9 /100 | #128 | Excellent $98,310 |
| Brazilians | 88.6 /100 | #129 | Excellent $98,267 |
| Immigrants | Kuwait | 87.8 /100 | #130 | Excellent $98,122 |
| Immigrants | Albania | 86.6 /100 | #131 | Excellent $97,929 |
| Immigrants | Zimbabwe | 86.3 /100 | #132 | Excellent $97,880 |
| Tsimshian | 85.8 /100 | #133 | Excellent $97,809 |
| Canadians | 84.5 /100 | #134 | Excellent $97,625 |
| Immigrants | Oceania | 84.5 /100 | #135 | Excellent $97,623 |
| Hungarians | 83.9 /100 | #136 | Excellent $97,544 |
| Lebanese | 82.3 /100 | #137 | Excellent $97,339 |