Immigrants from Dominica vs Immigrants from Kuwait Householder Income Ages 25 - 44 years
COMPARE
Immigrants from Dominica
Immigrants from Kuwait
Householder Income Ages 25 - 44 years
Householder Income Ages 25 - 44 years Comparison
Immigrants from Dominica
Immigrants from Kuwait
$81,351
HOUSEHOLDER INCOME AGES 25 - 44 YEARS
0.1/ 100
METRIC RATING
296th/ 347
METRIC RANK
$98,122
HOUSEHOLDER INCOME AGES 25 - 44 YEARS
87.8/ 100
METRIC RATING
130th/ 347
METRIC RANK
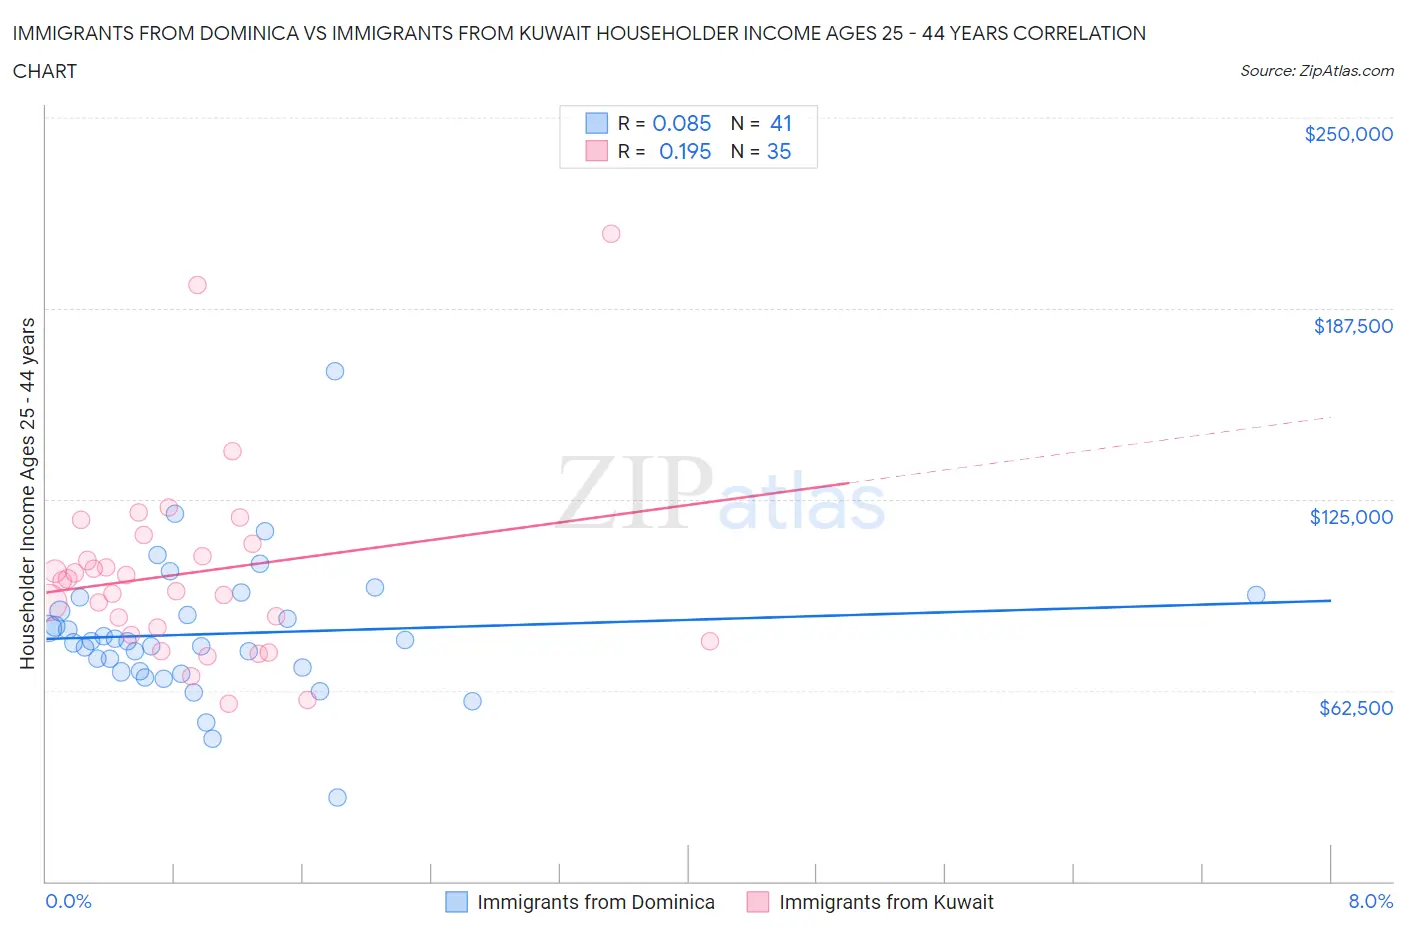
Immigrants from Dominica vs Immigrants from Kuwait Householder Income Ages 25 - 44 years Correlation Chart
The statistical analysis conducted on geographies consisting of 83,772,470 people shows a slight positive correlation between the proportion of Immigrants from Dominica and household income with householder between the ages 25 and 44 in the United States with a correlation coefficient (R) of 0.085 and weighted average of $81,351. Similarly, the statistical analysis conducted on geographies consisting of 136,849,136 people shows a poor positive correlation between the proportion of Immigrants from Kuwait and household income with householder between the ages 25 and 44 in the United States with a correlation coefficient (R) of 0.195 and weighted average of $98,122, a difference of 20.6%.
Householder Income Ages 25 - 44 years Correlation Summary
| Measurement | Immigrants from Dominica | Immigrants from Kuwait |
| Minimum | $27,269 | $58,000 |
| Maximum | $167,054 | $211,833 |
| Range | $139,785 | $153,833 |
| Mean | $80,956 | $100,890 |
| Median | $78,585 | $98,273 |
| Interquartile 25% (IQ1) | $68,699 | $80,635 |
| Interquartile 75% (IQ3) | $90,712 | $110,365 |
| Interquartile Range (IQR) | $22,013 | $29,730 |
| Standard Deviation (Sample) | $22,322 | $31,630 |
| Standard Deviation (Population) | $22,048 | $31,175 |
Similar Demographics by Householder Income Ages 25 - 44 years
Demographics Similar to Immigrants from Dominica by Householder Income Ages 25 - 44 years
In terms of householder income ages 25 - 44 years, the demographic groups most similar to Immigrants from Dominica are Immigrants from Guatemala ($81,341, a difference of 0.010%), Bangladeshi ($81,363, a difference of 0.020%), Dominican ($81,229, a difference of 0.15%), Cuban ($81,483, a difference of 0.16%), and Blackfeet ($81,531, a difference of 0.22%).
| Demographics | Rating | Rank | Householder Income Ages 25 - 44 years |
| Shoshone | 0.1 /100 | #289 | Tragic $82,062 |
| Liberians | 0.1 /100 | #290 | Tragic $82,005 |
| Potawatomi | 0.1 /100 | #291 | Tragic $81,774 |
| Yaqui | 0.1 /100 | #292 | Tragic $81,656 |
| Blackfeet | 0.1 /100 | #293 | Tragic $81,531 |
| Cubans | 0.1 /100 | #294 | Tragic $81,483 |
| Bangladeshis | 0.1 /100 | #295 | Tragic $81,363 |
| Immigrants | Dominica | 0.1 /100 | #296 | Tragic $81,351 |
| Immigrants | Guatemala | 0.1 /100 | #297 | Tragic $81,341 |
| Dominicans | 0.1 /100 | #298 | Tragic $81,229 |
| Immigrants | Liberia | 0.1 /100 | #299 | Tragic $80,863 |
| Cherokee | 0.0 /100 | #300 | Tragic $80,843 |
| Immigrants | Micronesia | 0.0 /100 | #301 | Tragic $80,544 |
| Hispanics or Latinos | 0.0 /100 | #302 | Tragic $80,515 |
| Mexicans | 0.0 /100 | #303 | Tragic $80,427 |
Demographics Similar to Immigrants from Kuwait by Householder Income Ages 25 - 44 years
In terms of householder income ages 25 - 44 years, the demographic groups most similar to Immigrants from Kuwait are Brazilian ($98,267, a difference of 0.15%), European ($98,310, a difference of 0.19%), Serbian ($98,320, a difference of 0.20%), Immigrants from Albania ($97,929, a difference of 0.20%), and British ($98,359, a difference of 0.24%).
| Demographics | Rating | Rank | Householder Income Ages 25 - 44 years |
| Palestinians | 91.2 /100 | #123 | Exceptional $98,777 |
| Zimbabweans | 90.3 /100 | #124 | Exceptional $98,586 |
| Pakistanis | 89.3 /100 | #125 | Excellent $98,401 |
| British | 89.1 /100 | #126 | Excellent $98,359 |
| Serbians | 88.9 /100 | #127 | Excellent $98,320 |
| Europeans | 88.9 /100 | #128 | Excellent $98,310 |
| Brazilians | 88.6 /100 | #129 | Excellent $98,267 |
| Immigrants | Kuwait | 87.8 /100 | #130 | Excellent $98,122 |
| Immigrants | Albania | 86.6 /100 | #131 | Excellent $97,929 |
| Immigrants | Zimbabwe | 86.3 /100 | #132 | Excellent $97,880 |
| Tsimshian | 85.8 /100 | #133 | Excellent $97,809 |
| Canadians | 84.5 /100 | #134 | Excellent $97,625 |
| Immigrants | Oceania | 84.5 /100 | #135 | Excellent $97,623 |
| Hungarians | 83.9 /100 | #136 | Excellent $97,544 |
| Lebanese | 82.3 /100 | #137 | Excellent $97,339 |