Immigrants from Egypt vs Egyptian Per Capita Income
COMPARE
Immigrants from Egypt
Egyptian
Per Capita Income
Per Capita Income Comparison
Immigrants from Egypt
Egyptians
$47,361
PER CAPITA INCOME
98.5/ 100
METRIC RATING
95th/ 347
METRIC RANK
$48,358
PER CAPITA INCOME
99.5/ 100
METRIC RATING
80th/ 347
METRIC RANK
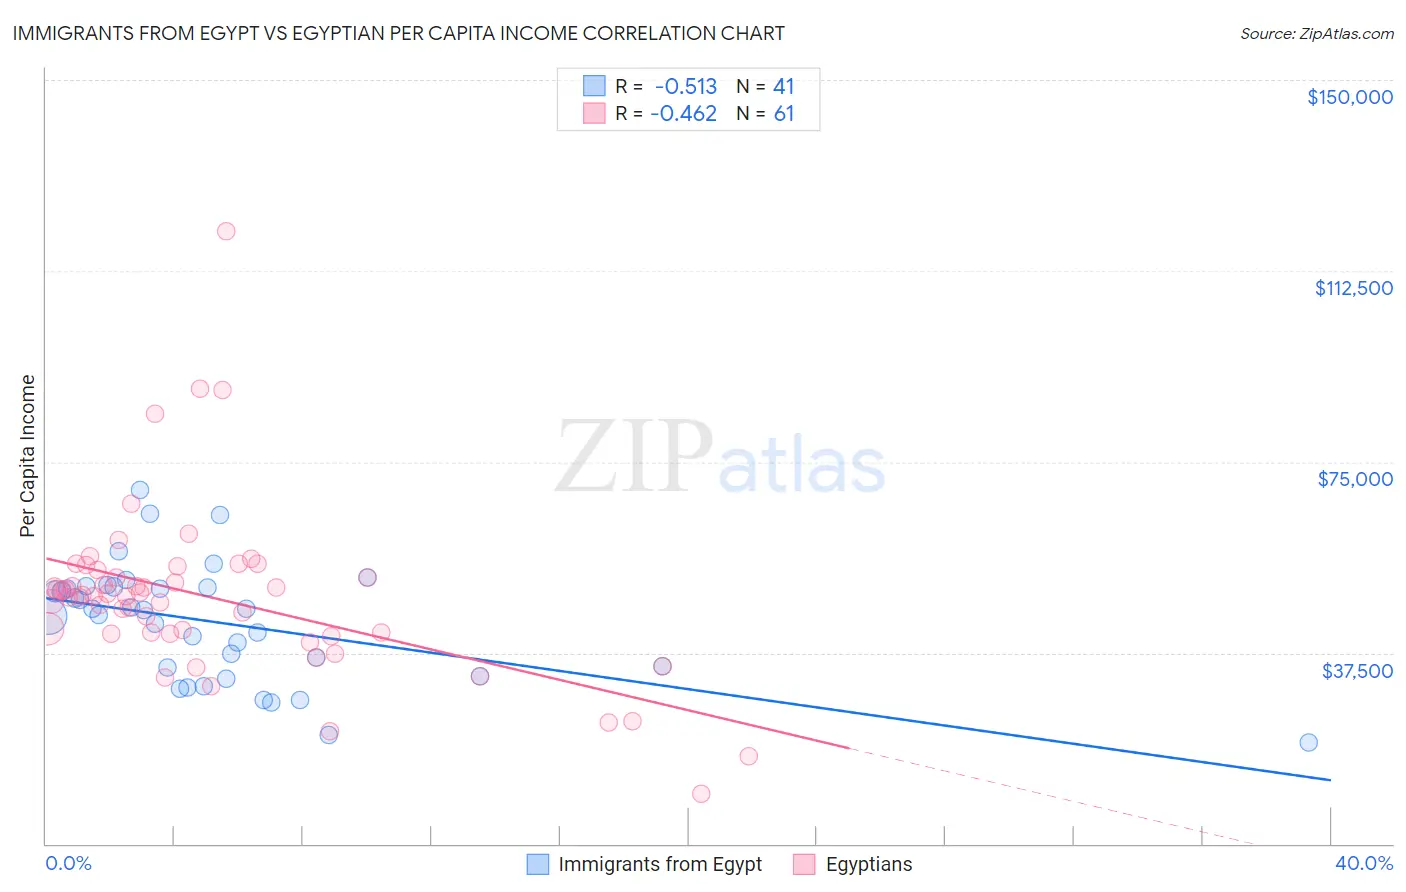
Immigrants from Egypt vs Egyptian Per Capita Income Correlation Chart
The statistical analysis conducted on geographies consisting of 245,495,655 people shows a substantial negative correlation between the proportion of Immigrants from Egypt and per capita income in the United States with a correlation coefficient (R) of -0.513 and weighted average of $47,361. Similarly, the statistical analysis conducted on geographies consisting of 276,936,692 people shows a moderate negative correlation between the proportion of Egyptians and per capita income in the United States with a correlation coefficient (R) of -0.462 and weighted average of $48,358, a difference of 2.1%.
Per Capita Income Correlation Summary
| Measurement | Immigrants from Egypt | Egyptian |
| Minimum | $19,900 | $9,805 |
| Maximum | $69,371 | $120,225 |
| Range | $49,471 | $110,420 |
| Mean | $43,359 | $48,391 |
| Median | $45,851 | $48,690 |
| Interquartile 25% (IQ1) | $33,676 | $41,170 |
| Interquartile 75% (IQ3) | $50,334 | $53,076 |
| Interquartile Range (IQR) | $16,658 | $11,906 |
| Standard Deviation (Sample) | $11,446 | $16,881 |
| Standard Deviation (Population) | $11,305 | $16,742 |
Demographics Similar to Immigrants from Egypt and Egyptians by Per Capita Income
In terms of per capita income, the demographic groups most similar to Immigrants from Egypt are Albanian ($47,379, a difference of 0.040%), Immigrants from Zimbabwe ($47,394, a difference of 0.070%), Alsatian ($47,284, a difference of 0.16%), Carpatho Rusyn ($47,248, a difference of 0.24%), and Immigrants from Moldova ($47,489, a difference of 0.27%). Similarly, the demographic groups most similar to Egyptians are Armenian ($48,287, a difference of 0.15%), Romanian ($48,445, a difference of 0.18%), Immigrants from Indonesia ($48,195, a difference of 0.34%), Immigrants from Brazil ($48,164, a difference of 0.40%), and Immigrants from Ukraine ($48,134, a difference of 0.46%).
| Demographics | Rating | Rank | Per Capita Income |
| Immigrants | Kazakhstan | 99.7 /100 | #77 | Exceptional $48,747 |
| Immigrants | Italy | 99.6 /100 | #78 | Exceptional $48,654 |
| Romanians | 99.5 /100 | #79 | Exceptional $48,445 |
| Egyptians | 99.5 /100 | #80 | Exceptional $48,358 |
| Armenians | 99.4 /100 | #81 | Exceptional $48,287 |
| Immigrants | Indonesia | 99.4 /100 | #82 | Exceptional $48,195 |
| Immigrants | Brazil | 99.4 /100 | #83 | Exceptional $48,164 |
| Immigrants | Ukraine | 99.3 /100 | #84 | Exceptional $48,134 |
| Austrians | 99.3 /100 | #85 | Exceptional $48,116 |
| Immigrants | Southern Europe | 99.3 /100 | #86 | Exceptional $48,027 |
| Ukrainians | 99.3 /100 | #87 | Exceptional $48,014 |
| Croatians | 99.0 /100 | #88 | Exceptional $47,742 |
| Northern Europeans | 98.9 /100 | #89 | Exceptional $47,698 |
| Italians | 98.8 /100 | #90 | Exceptional $47,574 |
| Macedonians | 98.8 /100 | #91 | Exceptional $47,573 |
| Immigrants | Moldova | 98.7 /100 | #92 | Exceptional $47,489 |
| Immigrants | Zimbabwe | 98.5 /100 | #93 | Exceptional $47,394 |
| Albanians | 98.5 /100 | #94 | Exceptional $47,379 |
| Immigrants | Egypt | 98.5 /100 | #95 | Exceptional $47,361 |
| Alsatians | 98.3 /100 | #96 | Exceptional $47,284 |
| Carpatho Rusyns | 98.2 /100 | #97 | Exceptional $47,248 |