Iroquois vs Scottish Median Male Earnings
COMPARE
Iroquois
Scottish
Median Male Earnings
Median Male Earnings Comparison
Iroquois
Scottish
$49,374
MEDIAN MALE EARNINGS
0.7/ 100
METRIC RATING
260th/ 347
METRIC RANK
$55,793
MEDIAN MALE EARNINGS
78.2/ 100
METRIC RATING
148th/ 347
METRIC RANK
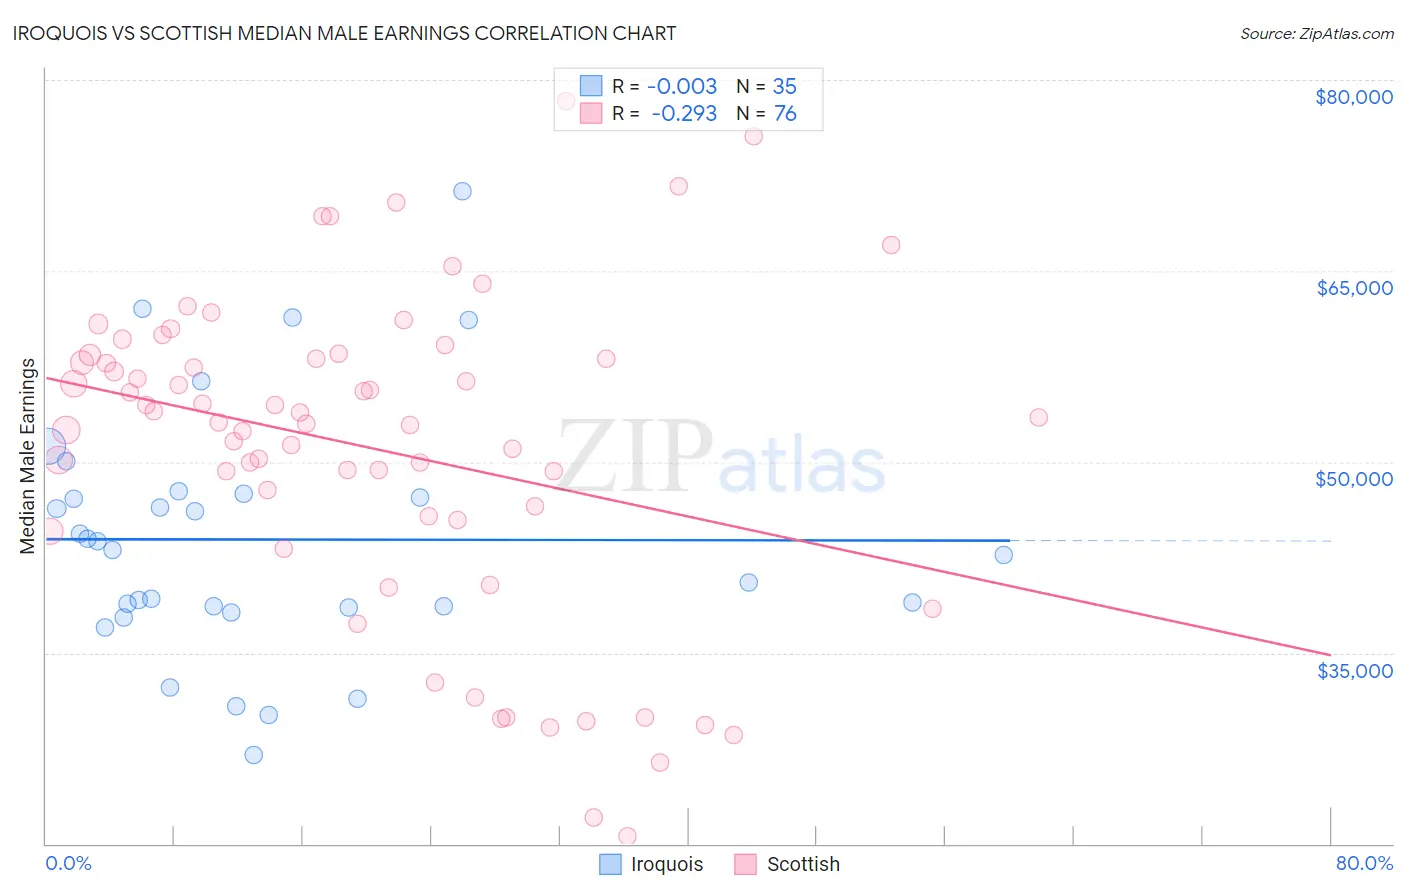
Iroquois vs Scottish Median Male Earnings Correlation Chart
The statistical analysis conducted on geographies consisting of 207,261,653 people shows no correlation between the proportion of Iroquois and median male earnings in the United States with a correlation coefficient (R) of -0.003 and weighted average of $49,374. Similarly, the statistical analysis conducted on geographies consisting of 565,821,197 people shows a weak negative correlation between the proportion of Scottish and median male earnings in the United States with a correlation coefficient (R) of -0.293 and weighted average of $55,793, a difference of 13.0%.
Median Male Earnings Correlation Summary
| Measurement | Iroquois | Scottish |
| Minimum | $26,985 | $20,625 |
| Maximum | $71,281 | $78,335 |
| Range | $44,296 | $57,710 |
| Mean | $43,903 | $51,052 |
| Median | $43,033 | $53,253 |
| Interquartile 25% (IQ1) | $38,514 | $45,587 |
| Interquartile 75% (IQ3) | $47,481 | $58,253 |
| Interquartile Range (IQR) | $8,967 | $12,667 |
| Standard Deviation (Sample) | $9,773 | $12,626 |
| Standard Deviation (Population) | $9,632 | $12,543 |
Similar Demographics by Median Male Earnings
Demographics Similar to Iroquois by Median Male Earnings
In terms of median male earnings, the demographic groups most similar to Iroquois are Liberian ($49,318, a difference of 0.11%), Nepalese ($49,458, a difference of 0.17%), Immigrants from West Indies ($49,271, a difference of 0.21%), Cree ($49,497, a difference of 0.25%), and Nicaraguan ($49,215, a difference of 0.32%).
| Demographics | Rating | Rank | Median Male Earnings |
| German Russians | 1.1 /100 | #253 | Tragic $49,924 |
| Senegalese | 1.0 /100 | #254 | Tragic $49,774 |
| Alaskan Athabascans | 0.9 /100 | #255 | Tragic $49,748 |
| Alaska Natives | 0.9 /100 | #256 | Tragic $49,711 |
| British West Indians | 0.8 /100 | #257 | Tragic $49,636 |
| Cree | 0.7 /100 | #258 | Tragic $49,497 |
| Nepalese | 0.7 /100 | #259 | Tragic $49,458 |
| Iroquois | 0.7 /100 | #260 | Tragic $49,374 |
| Liberians | 0.6 /100 | #261 | Tragic $49,318 |
| Immigrants | West Indies | 0.6 /100 | #262 | Tragic $49,271 |
| Nicaraguans | 0.6 /100 | #263 | Tragic $49,215 |
| Immigrants | Middle Africa | 0.6 /100 | #264 | Tragic $49,201 |
| Immigrants | Laos | 0.6 /100 | #265 | Tragic $49,190 |
| Somalis | 0.5 /100 | #266 | Tragic $49,025 |
| Spanish Americans | 0.5 /100 | #267 | Tragic $49,008 |
Demographics Similar to Scottish by Median Male Earnings
In terms of median male earnings, the demographic groups most similar to Scottish are Immigrants from Philippines ($55,809, a difference of 0.030%), English ($55,747, a difference of 0.080%), Swiss ($55,731, a difference of 0.11%), Immigrants from Oceania ($55,712, a difference of 0.15%), and Peruvian ($55,659, a difference of 0.24%).
| Demographics | Rating | Rank | Median Male Earnings |
| Danes | 84.8 /100 | #141 | Excellent $56,246 |
| Ethiopians | 84.8 /100 | #142 | Excellent $56,243 |
| Sri Lankans | 83.4 /100 | #143 | Excellent $56,136 |
| Immigrants | Uganda | 82.4 /100 | #144 | Excellent $56,064 |
| Norwegians | 80.9 /100 | #145 | Excellent $55,965 |
| Immigrants | Chile | 80.7 /100 | #146 | Excellent $55,954 |
| Immigrants | Philippines | 78.4 /100 | #147 | Good $55,809 |
| Scottish | 78.2 /100 | #148 | Good $55,793 |
| English | 77.4 /100 | #149 | Good $55,747 |
| Swiss | 77.1 /100 | #150 | Good $55,731 |
| Immigrants | Oceania | 76.8 /100 | #151 | Good $55,712 |
| Peruvians | 75.8 /100 | #152 | Good $55,659 |
| Immigrants | Nepal | 75.0 /100 | #153 | Good $55,615 |
| Taiwanese | 73.9 /100 | #154 | Good $55,556 |
| Scandinavians | 73.4 /100 | #155 | Good $55,527 |