Immigrants from Latvia vs Immigrants from Czechoslovakia Median Household Income
COMPARE
Immigrants from Latvia
Immigrants from Czechoslovakia
Median Household Income
Median Household Income Comparison
Immigrants from Latvia
Immigrants from Czechoslovakia
$93,602
MEDIAN HOUSEHOLD INCOME
99.6/ 100
METRIC RATING
74th/ 347
METRIC RANK
$95,319
MEDIAN HOUSEHOLD INCOME
99.9/ 100
METRIC RATING
55th/ 347
METRIC RANK
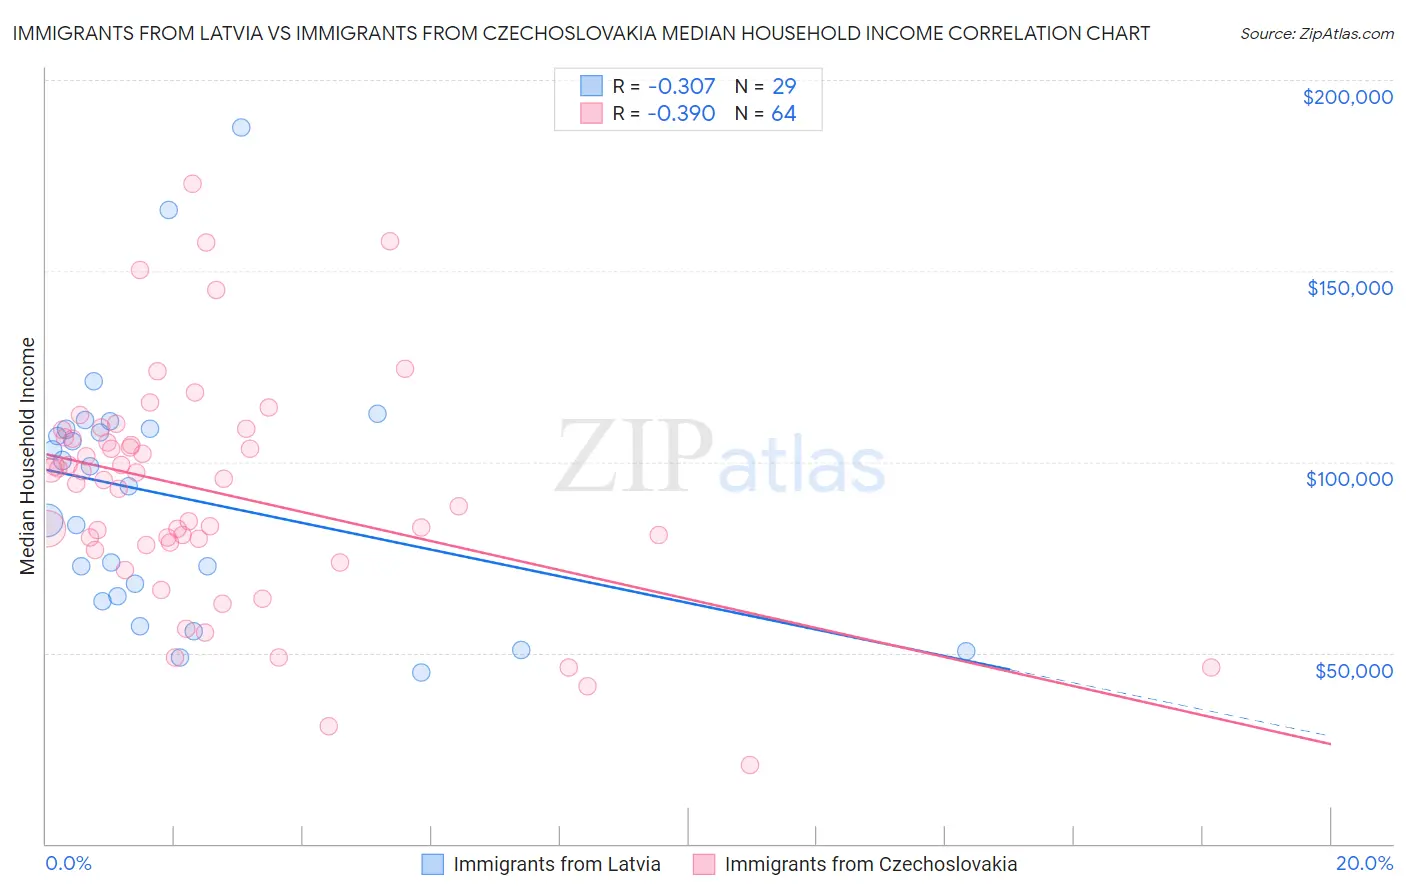
Immigrants from Latvia vs Immigrants from Czechoslovakia Median Household Income Correlation Chart
The statistical analysis conducted on geographies consisting of 113,726,313 people shows a mild negative correlation between the proportion of Immigrants from Latvia and median household income in the United States with a correlation coefficient (R) of -0.307 and weighted average of $93,602. Similarly, the statistical analysis conducted on geographies consisting of 195,443,038 people shows a mild negative correlation between the proportion of Immigrants from Czechoslovakia and median household income in the United States with a correlation coefficient (R) of -0.390 and weighted average of $95,319, a difference of 1.8%.
Median Household Income Correlation Summary
| Measurement | Immigrants from Latvia | Immigrants from Czechoslovakia |
| Minimum | $44,737 | $20,761 |
| Maximum | $187,593 | $172,802 |
| Range | $142,856 | $152,041 |
| Mean | $90,790 | $91,959 |
| Median | $93,558 | $95,339 |
| Interquartile 25% (IQ1) | $64,215 | $78,538 |
| Interquartile 75% (IQ3) | $108,638 | $106,288 |
| Interquartile Range (IQR) | $44,423 | $27,750 |
| Standard Deviation (Sample) | $33,495 | $29,573 |
| Standard Deviation (Population) | $32,912 | $29,341 |
Demographics Similar to Immigrants from Latvia and Immigrants from Czechoslovakia by Median Household Income
In terms of median household income, the demographic groups most similar to Immigrants from Latvia are Immigrants from Egypt ($93,700, a difference of 0.10%), Lithuanian ($93,852, a difference of 0.27%), Immigrants from Philippines ($93,899, a difference of 0.32%), Immigrants from Fiji ($93,933, a difference of 0.35%), and Argentinean ($93,960, a difference of 0.38%). Similarly, the demographic groups most similar to Immigrants from Czechoslovakia are Immigrants from Austria ($95,277, a difference of 0.040%), New Zealander ($95,146, a difference of 0.18%), Soviet Union ($95,098, a difference of 0.23%), Immigrants from Europe ($95,032, a difference of 0.30%), and Korean ($95,018, a difference of 0.32%).
| Demographics | Rating | Rank | Median Household Income |
| Egyptians | 99.9 /100 | #54 | Exceptional $95,673 |
| Immigrants | Czechoslovakia | 99.9 /100 | #55 | Exceptional $95,319 |
| Immigrants | Austria | 99.9 /100 | #56 | Exceptional $95,277 |
| New Zealanders | 99.8 /100 | #57 | Exceptional $95,146 |
| Soviet Union | 99.8 /100 | #58 | Exceptional $95,098 |
| Immigrants | Europe | 99.8 /100 | #59 | Exceptional $95,032 |
| Koreans | 99.8 /100 | #60 | Exceptional $95,018 |
| Laotians | 99.8 /100 | #61 | Exceptional $94,990 |
| Immigrants | Norway | 99.8 /100 | #62 | Exceptional $94,846 |
| Greeks | 99.8 /100 | #63 | Exceptional $94,735 |
| Immigrants | Netherlands | 99.7 /100 | #64 | Exceptional $94,411 |
| Immigrants | Belarus | 99.7 /100 | #65 | Exceptional $94,399 |
| Immigrants | Romania | 99.7 /100 | #66 | Exceptional $94,222 |
| Immigrants | Scotland | 99.7 /100 | #67 | Exceptional $94,091 |
| Mongolians | 99.7 /100 | #68 | Exceptional $93,971 |
| Argentineans | 99.7 /100 | #69 | Exceptional $93,960 |
| Immigrants | Fiji | 99.7 /100 | #70 | Exceptional $93,933 |
| Immigrants | Philippines | 99.6 /100 | #71 | Exceptional $93,899 |
| Lithuanians | 99.6 /100 | #72 | Exceptional $93,852 |
| Immigrants | Egypt | 99.6 /100 | #73 | Exceptional $93,700 |
| Immigrants | Latvia | 99.6 /100 | #74 | Exceptional $93,602 |