Iraqi vs Immigrants from Costa Rica 10th Grade
COMPARE
Iraqi
Immigrants from Costa Rica
10th Grade
10th Grade Comparison
Iraqis
Immigrants from Costa Rica
93.9%
10TH GRADE
68.1/ 100
METRIC RATING
164th/ 347
METRIC RANK
92.7%
10TH GRADE
0.6/ 100
METRIC RATING
258th/ 347
METRIC RANK
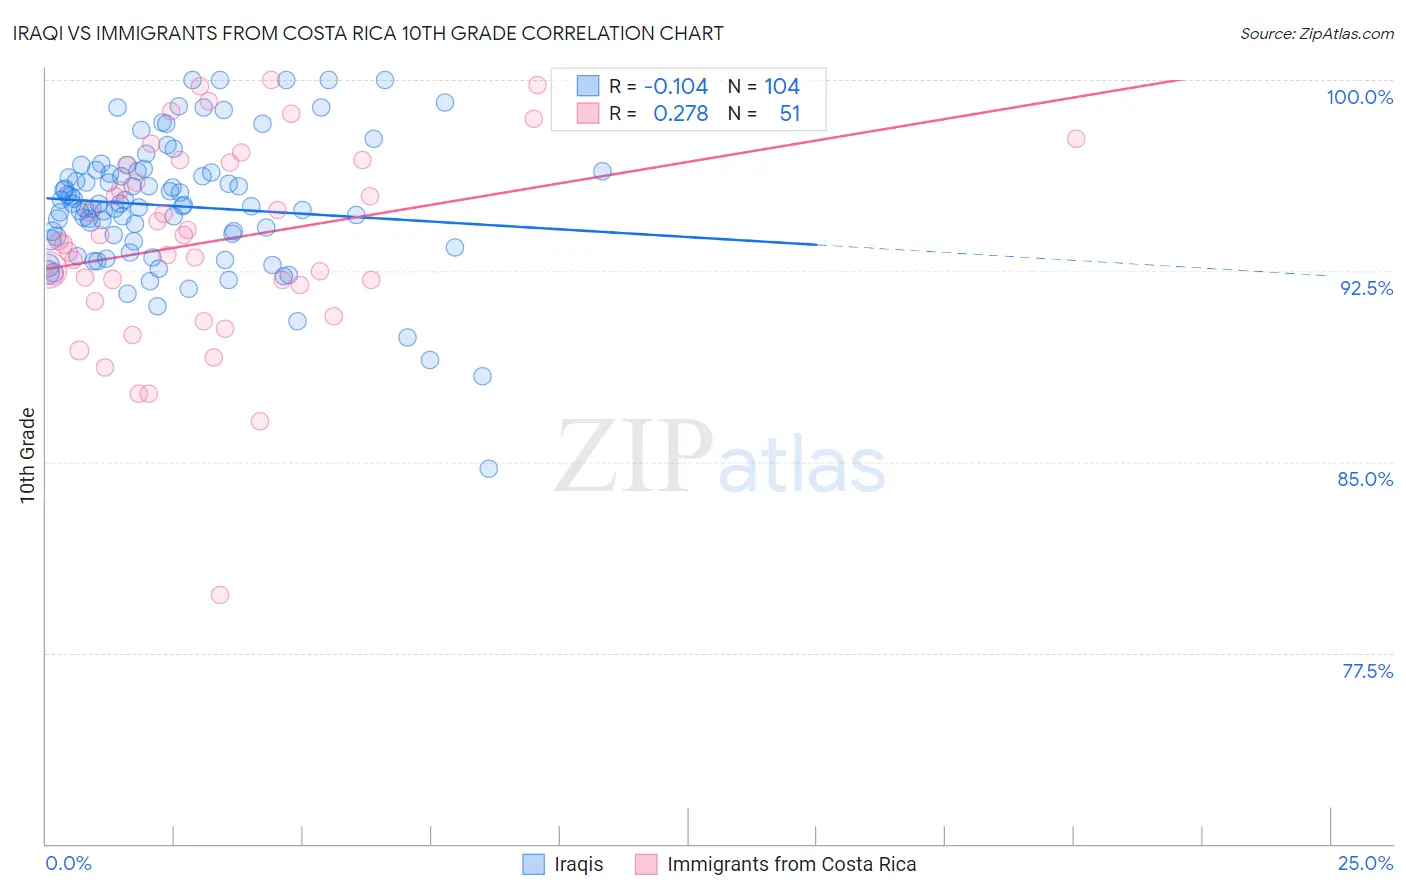
Iraqi vs Immigrants from Costa Rica 10th Grade Correlation Chart
The statistical analysis conducted on geographies consisting of 170,595,168 people shows a poor negative correlation between the proportion of Iraqis and percentage of population with at least 10th grade education in the United States with a correlation coefficient (R) of -0.104 and weighted average of 93.9%. Similarly, the statistical analysis conducted on geographies consisting of 204,277,241 people shows a weak positive correlation between the proportion of Immigrants from Costa Rica and percentage of population with at least 10th grade education in the United States with a correlation coefficient (R) of 0.278 and weighted average of 92.7%, a difference of 1.3%.
10th Grade Correlation Summary
| Measurement | Iraqi | Immigrants from Costa Rica |
| Minimum | 84.7% | 79.8% |
| Maximum | 100.0% | 100.0% |
| Range | 15.3% | 20.2% |
| Mean | 95.0% | 93.7% |
| Median | 95.1% | 93.7% |
| Interquartile 25% (IQ1) | 93.7% | 91.9% |
| Interquartile 75% (IQ3) | 96.4% | 96.8% |
| Interquartile Range (IQR) | 2.7% | 4.9% |
| Standard Deviation (Sample) | 2.6% | 3.9% |
| Standard Deviation (Population) | 2.6% | 3.9% |
Similar Demographics by 10th Grade
Demographics Similar to Iraqis by 10th Grade
In terms of 10th grade, the demographic groups most similar to Iraqis are Venezuelan (93.9%, a difference of 0.010%), Chilean (93.9%, a difference of 0.020%), Pakistani (93.9%, a difference of 0.020%), Assyrian/Chaldean/Syriac (93.9%, a difference of 0.020%), and Immigrants from Poland (93.9%, a difference of 0.020%).
| Demographics | Rating | Rank | 10th Grade |
| Kiowa | 73.3 /100 | #157 | Good 93.9% |
| Bermudans | 71.0 /100 | #158 | Good 93.9% |
| Chileans | 70.2 /100 | #159 | Good 93.9% |
| Pakistanis | 70.1 /100 | #160 | Good 93.9% |
| Assyrians/Chaldeans/Syriacs | 69.7 /100 | #161 | Good 93.9% |
| Immigrants | Poland | 69.6 /100 | #162 | Good 93.9% |
| Venezuelans | 69.5 /100 | #163 | Good 93.9% |
| Iraqis | 68.1 /100 | #164 | Good 93.9% |
| Brazilians | 63.6 /100 | #165 | Good 93.8% |
| Immigrants | Iraq | 63.0 /100 | #166 | Good 93.8% |
| Immigrants | Egypt | 62.3 /100 | #167 | Good 93.8% |
| Alsatians | 59.4 /100 | #168 | Average 93.8% |
| Immigrants | Spain | 55.9 /100 | #169 | Average 93.8% |
| Immigrants | Venezuela | 53.9 /100 | #170 | Average 93.8% |
| Immigrants | Albania | 52.4 /100 | #171 | Average 93.8% |
Demographics Similar to Immigrants from Costa Rica by 10th Grade
In terms of 10th grade, the demographic groups most similar to Immigrants from Costa Rica are U.S. Virgin Islander (92.7%, a difference of 0.010%), Immigrants from Nigeria (92.7%, a difference of 0.020%), Immigrants from Bolivia (92.7%, a difference of 0.030%), Immigrants from Jamaica (92.6%, a difference of 0.040%), and Immigrants from Uzbekistan (92.6%, a difference of 0.050%).
| Demographics | Rating | Rank | 10th Grade |
| Immigrants | Thailand | 1.0 /100 | #251 | Tragic 92.8% |
| South Americans | 0.9 /100 | #252 | Tragic 92.8% |
| Ghanaians | 0.9 /100 | #253 | Tragic 92.8% |
| Armenians | 0.9 /100 | #254 | Tragic 92.7% |
| Immigrants | Bolivia | 0.7 /100 | #255 | Tragic 92.7% |
| Immigrants | Nigeria | 0.7 /100 | #256 | Tragic 92.7% |
| U.S. Virgin Islanders | 0.7 /100 | #257 | Tragic 92.7% |
| Immigrants | Costa Rica | 0.6 /100 | #258 | Tragic 92.7% |
| Immigrants | Jamaica | 0.5 /100 | #259 | Tragic 92.6% |
| Immigrants | Uzbekistan | 0.5 /100 | #260 | Tragic 92.6% |
| Paiute | 0.4 /100 | #261 | Tragic 92.6% |
| Immigrants | South America | 0.4 /100 | #262 | Tragic 92.6% |
| Apache | 0.4 /100 | #263 | Tragic 92.6% |
| Peruvians | 0.4 /100 | #264 | Tragic 92.6% |
| Dutch West Indians | 0.4 /100 | #265 | Tragic 92.6% |