Immigrants from Ghana vs Immigrants from Iraq Householder Income Over 65 years
COMPARE
Immigrants from Ghana
Immigrants from Iraq
Householder Income Over 65 years
Householder Income Over 65 years Comparison
Immigrants from Ghana
Immigrants from Iraq
$58,624
HOUSEHOLDER INCOME OVER 65 YEARS
7.9/ 100
METRIC RATING
215th/ 347
METRIC RANK
$59,824
HOUSEHOLDER INCOME OVER 65 YEARS
23.2/ 100
METRIC RATING
195th/ 347
METRIC RANK
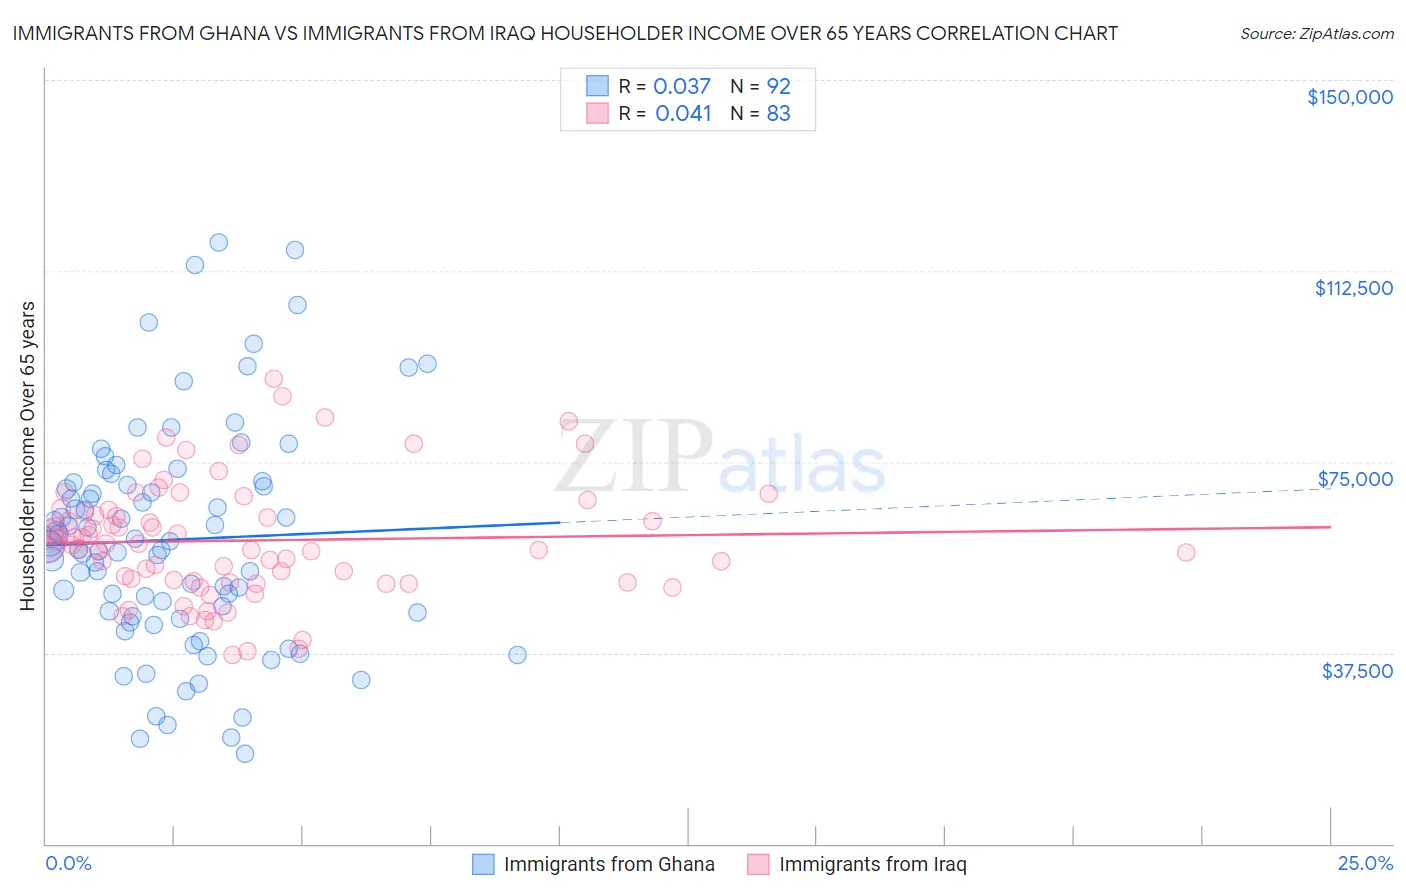
Immigrants from Ghana vs Immigrants from Iraq Householder Income Over 65 years Correlation Chart
The statistical analysis conducted on geographies consisting of 199,306,105 people shows no correlation between the proportion of Immigrants from Ghana and household income with householder over the age of 65 in the United States with a correlation coefficient (R) of 0.037 and weighted average of $58,624. Similarly, the statistical analysis conducted on geographies consisting of 194,612,135 people shows no correlation between the proportion of Immigrants from Iraq and household income with householder over the age of 65 in the United States with a correlation coefficient (R) of 0.041 and weighted average of $59,824, a difference of 2.1%.
Householder Income Over 65 years Correlation Summary
| Measurement | Immigrants from Ghana | Immigrants from Iraq |
| Minimum | $17,788 | $37,148 |
| Maximum | $118,015 | $91,250 |
| Range | $100,227 | $54,102 |
| Mean | $59,709 | $59,538 |
| Median | $58,613 | $58,855 |
| Interquartile 25% (IQ1) | $45,151 | $51,355 |
| Interquartile 75% (IQ3) | $70,697 | $65,529 |
| Interquartile Range (IQR) | $25,546 | $14,174 |
| Standard Deviation (Sample) | $21,702 | $11,528 |
| Standard Deviation (Population) | $21,584 | $11,458 |
Demographics Similar to Immigrants from Ghana and Immigrants from Iraq by Householder Income Over 65 years
In terms of householder income over 65 years, the demographic groups most similar to Immigrants from Ghana are Nepalese ($58,761, a difference of 0.23%), White/Caucasian ($58,847, a difference of 0.38%), Colombian ($58,851, a difference of 0.39%), Immigrants from Nigeria ($58,942, a difference of 0.54%), and Nigerian ($58,992, a difference of 0.63%). Similarly, the demographic groups most similar to Immigrants from Iraq are German ($59,730, a difference of 0.16%), Immigrants from Kenya ($59,710, a difference of 0.19%), Moroccan ($59,683, a difference of 0.24%), Immigrants ($59,656, a difference of 0.28%), and French ($59,656, a difference of 0.28%).
| Demographics | Rating | Rank | Householder Income Over 65 years |
| Immigrants | Iraq | 23.2 /100 | #195 | Fair $59,824 |
| Germans | 21.5 /100 | #196 | Fair $59,730 |
| Immigrants | Kenya | 21.1 /100 | #197 | Fair $59,710 |
| Moroccans | 20.7 /100 | #198 | Fair $59,683 |
| Immigrants | Immigrants | 20.2 /100 | #199 | Fair $59,656 |
| French | 20.2 /100 | #200 | Fair $59,656 |
| Dutch | 18.3 /100 | #201 | Poor $59,539 |
| Finns | 18.2 /100 | #202 | Poor $59,535 |
| Scotch-Irish | 16.9 /100 | #203 | Poor $59,447 |
| Arapaho | 16.0 /100 | #204 | Poor $59,383 |
| Immigrants | Sudan | 14.2 /100 | #205 | Poor $59,248 |
| Immigrants | South America | 13.0 /100 | #206 | Poor $59,151 |
| Salvadorans | 12.9 /100 | #207 | Poor $59,141 |
| Uruguayans | 12.3 /100 | #208 | Poor $59,090 |
| Slovaks | 11.7 /100 | #209 | Poor $59,039 |
| Nigerians | 11.2 /100 | #210 | Poor $58,992 |
| Immigrants | Nigeria | 10.7 /100 | #211 | Poor $58,942 |
| Colombians | 9.8 /100 | #212 | Tragic $58,851 |
| Whites/Caucasians | 9.8 /100 | #213 | Tragic $58,847 |
| Nepalese | 9.0 /100 | #214 | Tragic $58,761 |
| Immigrants | Ghana | 7.9 /100 | #215 | Tragic $58,624 |