Celtic vs Immigrants from Iraq Householder Income Over 65 years
COMPARE
Celtic
Immigrants from Iraq
Householder Income Over 65 years
Householder Income Over 65 years Comparison
Celtics
Immigrants from Iraq
$60,608
HOUSEHOLDER INCOME OVER 65 YEARS
40.7/ 100
METRIC RATING
181st/ 347
METRIC RANK
$59,824
HOUSEHOLDER INCOME OVER 65 YEARS
23.2/ 100
METRIC RATING
195th/ 347
METRIC RANK
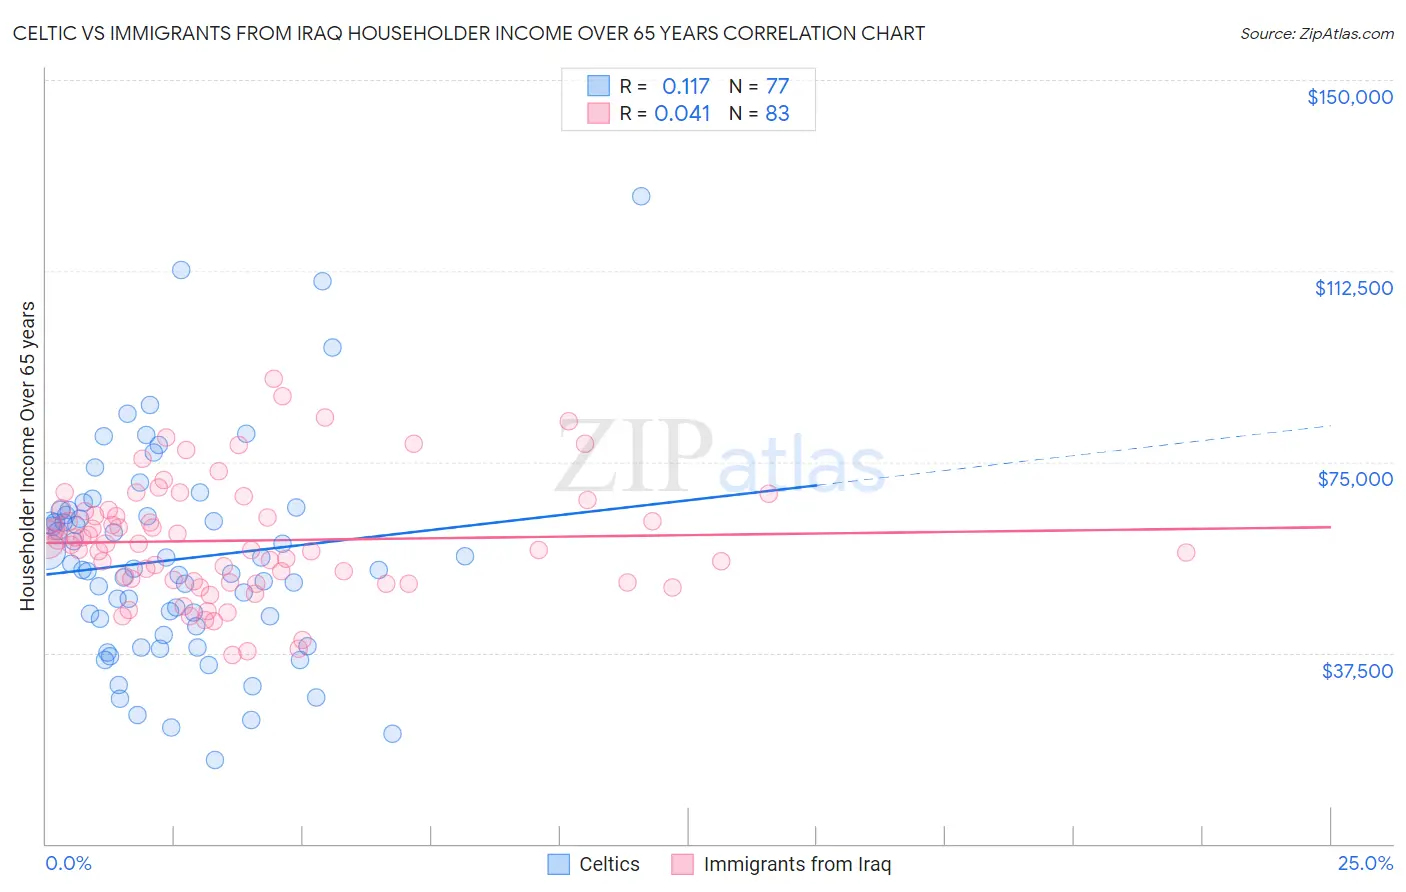
Celtic vs Immigrants from Iraq Householder Income Over 65 years Correlation Chart
The statistical analysis conducted on geographies consisting of 168,665,390 people shows a poor positive correlation between the proportion of Celtics and household income with householder over the age of 65 in the United States with a correlation coefficient (R) of 0.117 and weighted average of $60,608. Similarly, the statistical analysis conducted on geographies consisting of 194,612,135 people shows no correlation between the proportion of Immigrants from Iraq and household income with householder over the age of 65 in the United States with a correlation coefficient (R) of 0.041 and weighted average of $59,824, a difference of 1.3%.
Householder Income Over 65 years Correlation Summary
| Measurement | Celtic | Immigrants from Iraq |
| Minimum | $16,365 | $37,148 |
| Maximum | $127,250 | $91,250 |
| Range | $110,885 | $54,102 |
| Mean | $55,793 | $59,538 |
| Median | $53,750 | $58,855 |
| Interquartile 25% (IQ1) | $41,861 | $51,355 |
| Interquartile 75% (IQ3) | $65,041 | $65,529 |
| Interquartile Range (IQR) | $23,179 | $14,174 |
| Standard Deviation (Sample) | $20,641 | $11,528 |
| Standard Deviation (Population) | $20,507 | $11,458 |
Demographics Similar to Celtics and Immigrants from Iraq by Householder Income Over 65 years
In terms of householder income over 65 years, the demographic groups most similar to Celtics are Czechoslovakian ($60,581, a difference of 0.040%), Immigrants from Morocco ($60,647, a difference of 0.060%), Welsh ($60,666, a difference of 0.10%), Kenyan ($60,514, a difference of 0.15%), and Yup'ik ($60,727, a difference of 0.20%). Similarly, the demographic groups most similar to Immigrants from Iraq are Immigrants from Africa ($59,837, a difference of 0.020%), Immigrants from Costa Rica ($59,848, a difference of 0.040%), South American ($59,854, a difference of 0.050%), Belgian ($59,915, a difference of 0.15%), and German ($59,730, a difference of 0.16%).
| Demographics | Rating | Rank | Householder Income Over 65 years |
| Yup'ik | 43.7 /100 | #178 | Average $60,727 |
| Welsh | 42.2 /100 | #179 | Average $60,666 |
| Immigrants | Morocco | 41.7 /100 | #180 | Average $60,647 |
| Celtics | 40.7 /100 | #181 | Average $60,608 |
| Czechoslovakians | 40.0 /100 | #182 | Average $60,581 |
| Kenyans | 38.4 /100 | #183 | Fair $60,514 |
| Iraqis | 37.2 /100 | #184 | Fair $60,466 |
| Albanians | 32.0 /100 | #185 | Fair $60,249 |
| Slovenes | 31.8 /100 | #186 | Fair $60,241 |
| Immigrants | Thailand | 31.3 /100 | #187 | Fair $60,217 |
| Immigrants | Eritrea | 28.6 /100 | #188 | Fair $60,096 |
| Ghanaians | 27.5 /100 | #189 | Fair $60,043 |
| Puget Sound Salish | 25.3 /100 | #190 | Fair $59,934 |
| Belgians | 24.9 /100 | #191 | Fair $59,915 |
| South Americans | 23.8 /100 | #192 | Fair $59,854 |
| Immigrants | Costa Rica | 23.6 /100 | #193 | Fair $59,848 |
| Immigrants | Africa | 23.4 /100 | #194 | Fair $59,837 |
| Immigrants | Iraq | 23.2 /100 | #195 | Fair $59,824 |
| Germans | 21.5 /100 | #196 | Fair $59,730 |
| Immigrants | Kenya | 21.1 /100 | #197 | Fair $59,710 |
| Moroccans | 20.7 /100 | #198 | Fair $59,683 |