Immigrants from England vs Immigrants from Iraq Householder Income Over 65 years
COMPARE
Immigrants from England
Immigrants from Iraq
Householder Income Over 65 years
Householder Income Over 65 years Comparison
Immigrants from England
Immigrants from Iraq
$65,715
HOUSEHOLDER INCOME OVER 65 YEARS
99.3/ 100
METRIC RATING
65th/ 347
METRIC RANK
$59,824
HOUSEHOLDER INCOME OVER 65 YEARS
23.2/ 100
METRIC RATING
195th/ 347
METRIC RANK
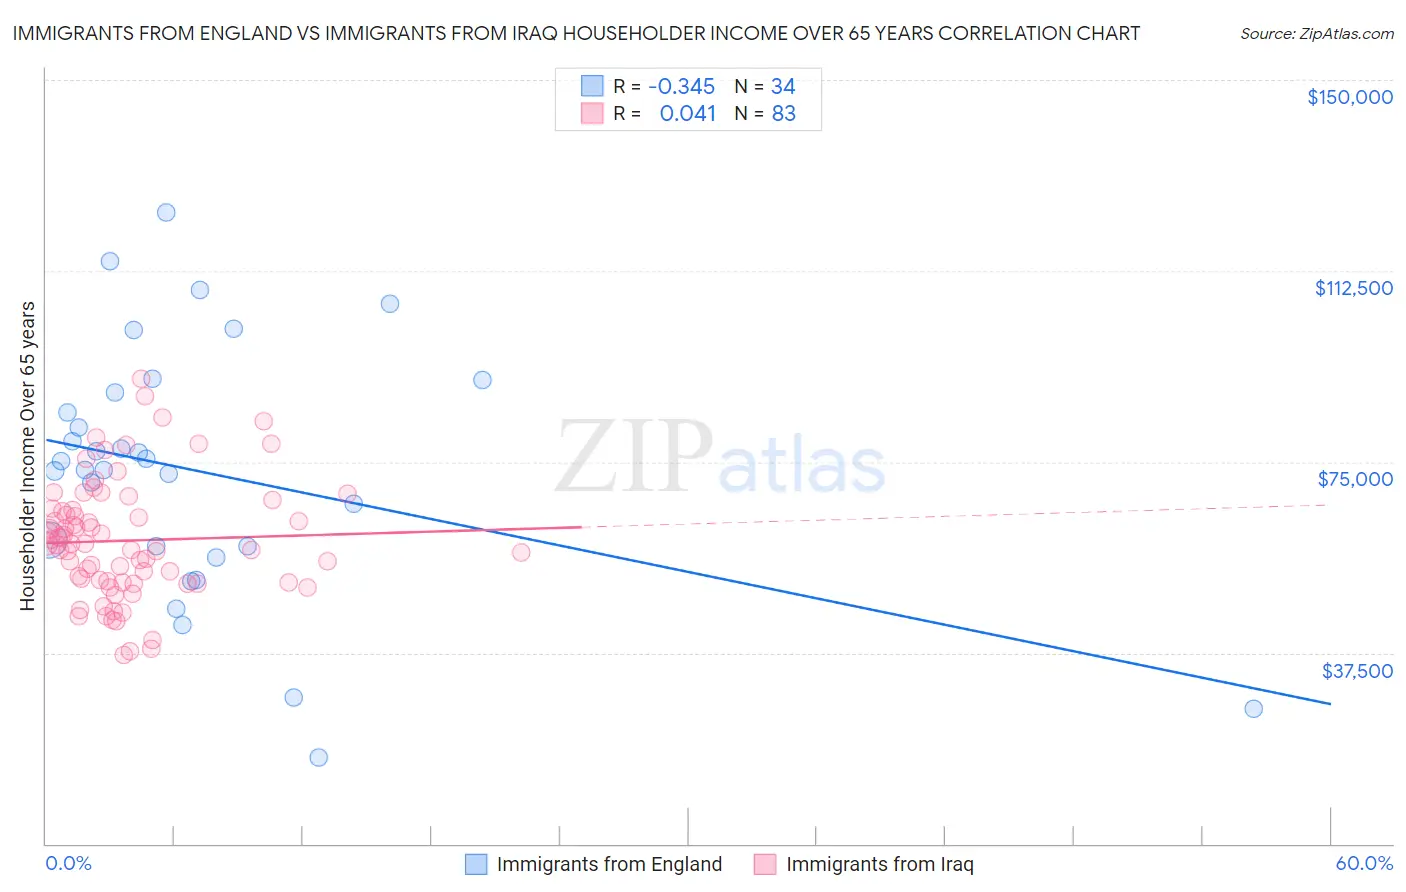
Immigrants from England vs Immigrants from Iraq Householder Income Over 65 years Correlation Chart
The statistical analysis conducted on geographies consisting of 391,074,027 people shows a mild negative correlation between the proportion of Immigrants from England and household income with householder over the age of 65 in the United States with a correlation coefficient (R) of -0.345 and weighted average of $65,715. Similarly, the statistical analysis conducted on geographies consisting of 194,612,135 people shows no correlation between the proportion of Immigrants from Iraq and household income with householder over the age of 65 in the United States with a correlation coefficient (R) of 0.041 and weighted average of $59,824, a difference of 9.9%.
Householder Income Over 65 years Correlation Summary
| Measurement | Immigrants from England | Immigrants from Iraq |
| Minimum | $16,875 | $37,148 |
| Maximum | $124,064 | $91,250 |
| Range | $107,189 | $54,102 |
| Mean | $72,987 | $59,538 |
| Median | $74,315 | $58,855 |
| Interquartile 25% (IQ1) | $58,438 | $51,355 |
| Interquartile 75% (IQ3) | $88,575 | $65,529 |
| Interquartile Range (IQR) | $30,137 | $14,174 |
| Standard Deviation (Sample) | $24,739 | $11,528 |
| Standard Deviation (Population) | $24,372 | $11,458 |
Similar Demographics by Householder Income Over 65 years
Demographics Similar to Immigrants from England by Householder Income Over 65 years
In terms of householder income over 65 years, the demographic groups most similar to Immigrants from England are South African ($65,652, a difference of 0.10%), Zimbabwean ($65,854, a difference of 0.21%), Marshallese ($65,874, a difference of 0.24%), Immigrants from Malaysia ($65,497, a difference of 0.33%), and Egyptian ($65,441, a difference of 0.42%).
| Demographics | Rating | Rank | Householder Income Over 65 years |
| Immigrants | Philippines | 99.6 /100 | #58 | Exceptional $66,161 |
| Immigrants | Norway | 99.5 /100 | #59 | Exceptional $66,118 |
| Immigrants | Lithuania | 99.5 /100 | #60 | Exceptional $66,087 |
| Maltese | 99.5 /100 | #61 | Exceptional $66,027 |
| Immigrants | Sierra Leone | 99.5 /100 | #62 | Exceptional $66,009 |
| Marshallese | 99.4 /100 | #63 | Exceptional $65,874 |
| Zimbabweans | 99.4 /100 | #64 | Exceptional $65,854 |
| Immigrants | England | 99.3 /100 | #65 | Exceptional $65,715 |
| South Africans | 99.3 /100 | #66 | Exceptional $65,652 |
| Immigrants | Malaysia | 99.1 /100 | #67 | Exceptional $65,497 |
| Egyptians | 99.1 /100 | #68 | Exceptional $65,441 |
| Samoans | 99.1 /100 | #69 | Exceptional $65,427 |
| Mongolians | 99.0 /100 | #70 | Exceptional $65,326 |
| Greeks | 98.9 /100 | #71 | Exceptional $65,306 |
| Argentineans | 98.9 /100 | #72 | Exceptional $65,246 |
Demographics Similar to Immigrants from Iraq by Householder Income Over 65 years
In terms of householder income over 65 years, the demographic groups most similar to Immigrants from Iraq are Immigrants from Africa ($59,837, a difference of 0.020%), Immigrants from Costa Rica ($59,848, a difference of 0.040%), South American ($59,854, a difference of 0.050%), Belgian ($59,915, a difference of 0.15%), and German ($59,730, a difference of 0.16%).
| Demographics | Rating | Rank | Householder Income Over 65 years |
| Immigrants | Eritrea | 28.6 /100 | #188 | Fair $60,096 |
| Ghanaians | 27.5 /100 | #189 | Fair $60,043 |
| Puget Sound Salish | 25.3 /100 | #190 | Fair $59,934 |
| Belgians | 24.9 /100 | #191 | Fair $59,915 |
| South Americans | 23.8 /100 | #192 | Fair $59,854 |
| Immigrants | Costa Rica | 23.6 /100 | #193 | Fair $59,848 |
| Immigrants | Africa | 23.4 /100 | #194 | Fair $59,837 |
| Immigrants | Iraq | 23.2 /100 | #195 | Fair $59,824 |
| Germans | 21.5 /100 | #196 | Fair $59,730 |
| Immigrants | Kenya | 21.1 /100 | #197 | Fair $59,710 |
| Moroccans | 20.7 /100 | #198 | Fair $59,683 |
| Immigrants | Immigrants | 20.2 /100 | #199 | Fair $59,656 |
| French | 20.2 /100 | #200 | Fair $59,656 |
| Dutch | 18.3 /100 | #201 | Poor $59,539 |
| Finns | 18.2 /100 | #202 | Poor $59,535 |