Immigrants from Philippines vs Immigrants from Guatemala Median Earnings
COMPARE
Immigrants from Philippines
Immigrants from Guatemala
Median Earnings
Median Earnings Comparison
Immigrants from Philippines
Immigrants from Guatemala
$48,266
MEDIAN EARNINGS
92.9/ 100
METRIC RATING
128th/ 347
METRIC RANK
$40,851
MEDIAN EARNINGS
0.0/ 100
METRIC RATING
304th/ 347
METRIC RANK
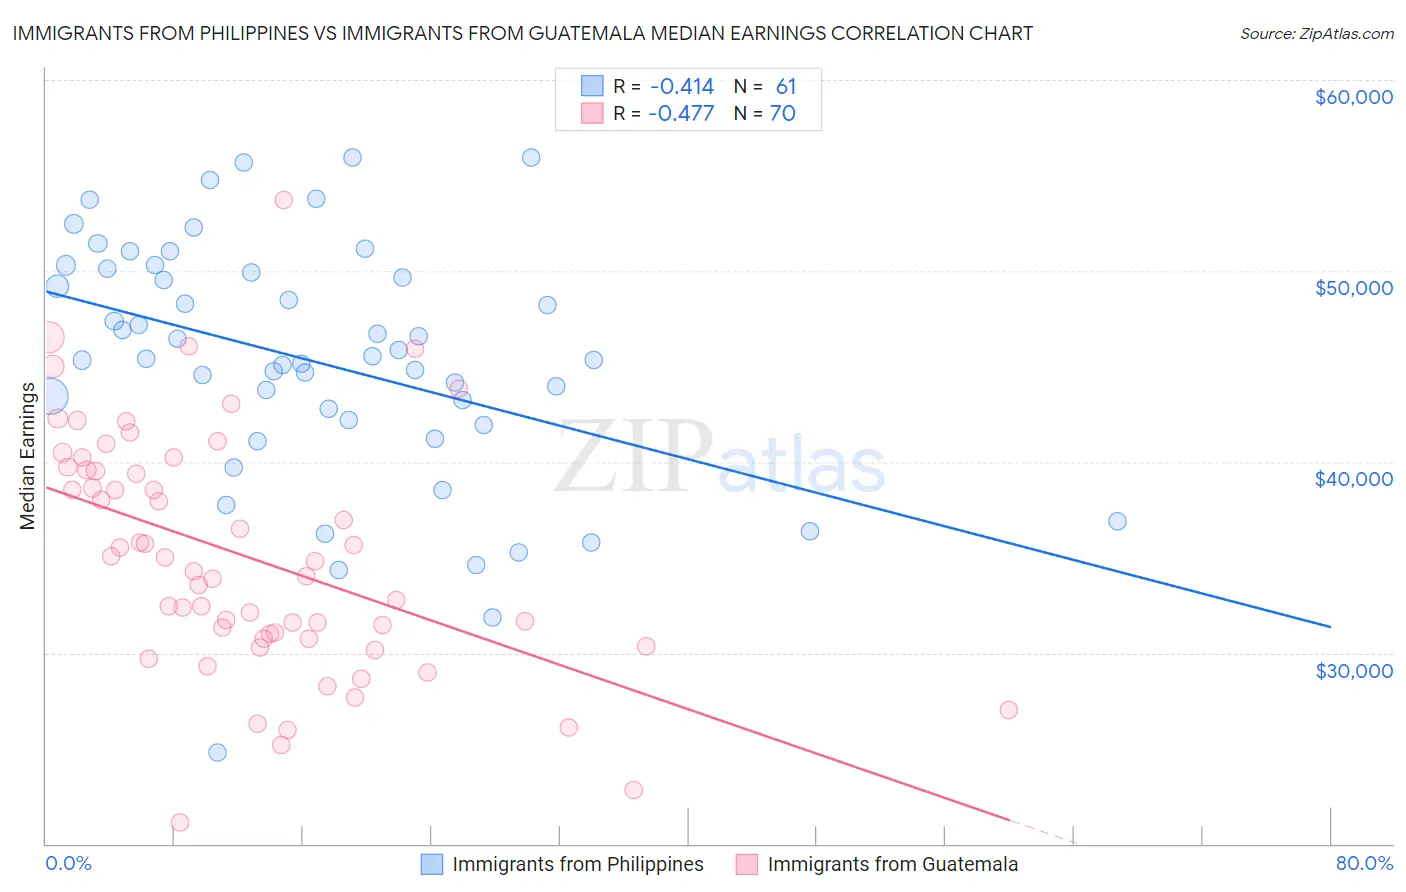
Immigrants from Philippines vs Immigrants from Guatemala Median Earnings Correlation Chart
The statistical analysis conducted on geographies consisting of 471,239,871 people shows a moderate negative correlation between the proportion of Immigrants from Philippines and median earnings in the United States with a correlation coefficient (R) of -0.414 and weighted average of $48,266. Similarly, the statistical analysis conducted on geographies consisting of 377,268,152 people shows a moderate negative correlation between the proportion of Immigrants from Guatemala and median earnings in the United States with a correlation coefficient (R) of -0.477 and weighted average of $40,851, a difference of 18.1%.
Median Earnings Correlation Summary
| Measurement | Immigrants from Philippines | Immigrants from Guatemala |
| Minimum | $24,776 | $21,140 |
| Maximum | $55,949 | $53,713 |
| Range | $31,173 | $32,573 |
| Mean | $45,260 | $35,043 |
| Median | $45,398 | $34,514 |
| Interquartile 25% (IQ1) | $42,071 | $30,761 |
| Interquartile 75% (IQ3) | $50,000 | $39,604 |
| Interquartile Range (IQR) | $7,929 | $8,843 |
| Standard Deviation (Sample) | $6,408 | $6,256 |
| Standard Deviation (Population) | $6,355 | $6,211 |
Similar Demographics by Median Earnings
Demographics Similar to Immigrants from Philippines by Median Earnings
In terms of median earnings, the demographic groups most similar to Immigrants from Philippines are Pakistani ($48,254, a difference of 0.020%), Sierra Leonean ($48,286, a difference of 0.040%), Immigrants from Fiji ($48,305, a difference of 0.080%), Assyrian/Chaldean/Syriac ($48,304, a difference of 0.080%), and Zimbabwean ($48,229, a difference of 0.080%).
| Demographics | Rating | Rank | Median Earnings |
| Arabs | 95.4 /100 | #121 | Exceptional $48,599 |
| Chileans | 94.8 /100 | #122 | Exceptional $48,504 |
| Immigrants | Syria | 93.9 /100 | #123 | Exceptional $48,375 |
| Brazilians | 93.7 /100 | #124 | Exceptional $48,356 |
| Immigrants | Fiji | 93.3 /100 | #125 | Exceptional $48,305 |
| Assyrians/Chaldeans/Syriacs | 93.3 /100 | #126 | Exceptional $48,304 |
| Sierra Leoneans | 93.1 /100 | #127 | Exceptional $48,286 |
| Immigrants | Philippines | 92.9 /100 | #128 | Exceptional $48,266 |
| Pakistanis | 92.8 /100 | #129 | Exceptional $48,254 |
| Zimbabweans | 92.6 /100 | #130 | Exceptional $48,229 |
| Lebanese | 92.5 /100 | #131 | Exceptional $48,226 |
| British | 92.2 /100 | #132 | Exceptional $48,189 |
| Immigrants | Uganda | 90.5 /100 | #133 | Exceptional $48,041 |
| Sri Lankans | 90.5 /100 | #134 | Exceptional $48,040 |
| Portuguese | 90.4 /100 | #135 | Exceptional $48,032 |
Demographics Similar to Immigrants from Guatemala by Median Earnings
In terms of median earnings, the demographic groups most similar to Immigrants from Guatemala are Haitian ($40,918, a difference of 0.16%), Shoshone ($40,932, a difference of 0.20%), Chickasaw ($40,672, a difference of 0.44%), Immigrants from Latin America ($41,049, a difference of 0.48%), and Ute ($41,051, a difference of 0.49%).
| Demographics | Rating | Rank | Median Earnings |
| Guatemalans | 0.1 /100 | #297 | Tragic $41,205 |
| Immigrants | Micronesia | 0.1 /100 | #298 | Tragic $41,133 |
| Immigrants | Caribbean | 0.1 /100 | #299 | Tragic $41,119 |
| Ute | 0.1 /100 | #300 | Tragic $41,051 |
| Immigrants | Latin America | 0.1 /100 | #301 | Tragic $41,049 |
| Shoshone | 0.0 /100 | #302 | Tragic $40,932 |
| Haitians | 0.0 /100 | #303 | Tragic $40,918 |
| Immigrants | Guatemala | 0.0 /100 | #304 | Tragic $40,851 |
| Chickasaw | 0.0 /100 | #305 | Tragic $40,672 |
| Yaqui | 0.0 /100 | #306 | Tragic $40,647 |
| Hondurans | 0.0 /100 | #307 | Tragic $40,638 |
| Cubans | 0.0 /100 | #308 | Tragic $40,619 |
| Immigrants | Haiti | 0.0 /100 | #309 | Tragic $40,550 |
| Apache | 0.0 /100 | #310 | Tragic $40,388 |
| Hispanics or Latinos | 0.0 /100 | #311 | Tragic $40,288 |