Indonesian vs Honduran Median Male Earnings
COMPARE
Indonesian
Honduran
Median Male Earnings
Median Male Earnings Comparison
Indonesians
Hondurans
$47,503
MEDIAN MALE EARNINGS
0.1/ 100
METRIC RATING
293rd/ 347
METRIC RANK
$46,374
MEDIAN MALE EARNINGS
0.0/ 100
METRIC RATING
313th/ 347
METRIC RANK
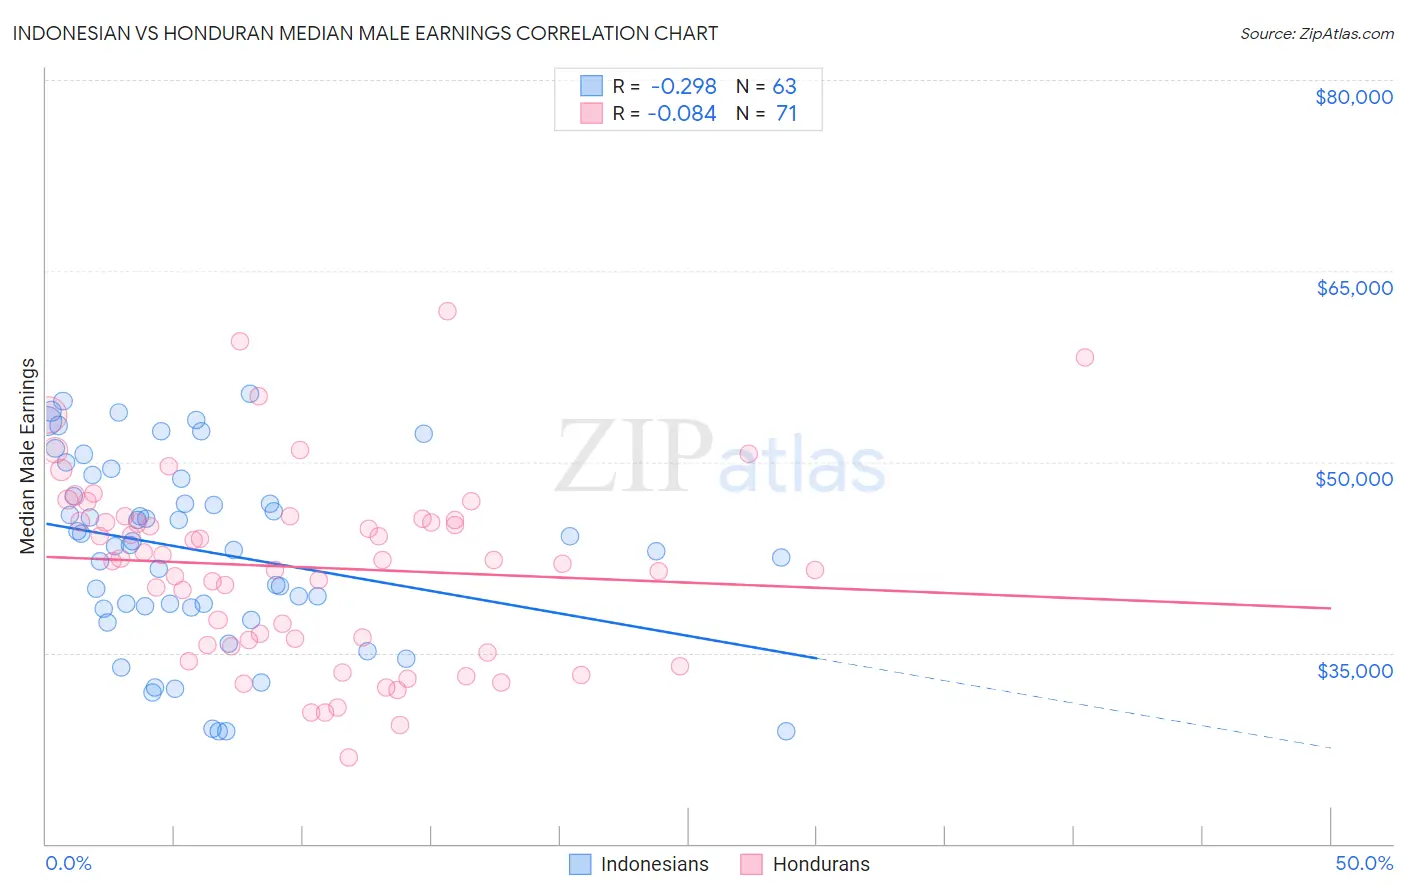
Indonesian vs Honduran Median Male Earnings Correlation Chart
The statistical analysis conducted on geographies consisting of 162,701,910 people shows a weak negative correlation between the proportion of Indonesians and median male earnings in the United States with a correlation coefficient (R) of -0.298 and weighted average of $47,503. Similarly, the statistical analysis conducted on geographies consisting of 357,792,552 people shows a slight negative correlation between the proportion of Hondurans and median male earnings in the United States with a correlation coefficient (R) of -0.084 and weighted average of $46,374, a difference of 2.4%.
Median Male Earnings Correlation Summary
| Measurement | Indonesian | Honduran |
| Minimum | $28,857 | $26,786 |
| Maximum | $55,385 | $61,786 |
| Range | $26,528 | $35,000 |
| Mean | $42,970 | $41,717 |
| Median | $43,436 | $42,264 |
| Interquartile 25% (IQ1) | $38,534 | $35,639 |
| Interquartile 75% (IQ3) | $48,720 | $45,572 |
| Interquartile Range (IQR) | $10,186 | $9,933 |
| Standard Deviation (Sample) | $7,238 | $7,373 |
| Standard Deviation (Population) | $7,181 | $7,321 |
Demographics Similar to Indonesians and Hondurans by Median Male Earnings
In terms of median male earnings, the demographic groups most similar to Indonesians are Immigrants from Nicaragua ($47,482, a difference of 0.040%), Central American Indian ($47,433, a difference of 0.15%), Inupiat ($47,281, a difference of 0.47%), Dominican ($47,204, a difference of 0.63%), and Immigrants from Micronesia ($47,177, a difference of 0.69%). Similarly, the demographic groups most similar to Hondurans are Hispanic or Latino ($46,419, a difference of 0.10%), Apache ($46,429, a difference of 0.12%), Cuban ($46,580, a difference of 0.44%), Creek ($46,594, a difference of 0.48%), and Ottawa ($46,611, a difference of 0.51%).
| Demographics | Rating | Rank | Median Male Earnings |
| Indonesians | 0.1 /100 | #293 | Tragic $47,503 |
| Immigrants | Nicaragua | 0.1 /100 | #294 | Tragic $47,482 |
| Central American Indians | 0.1 /100 | #295 | Tragic $47,433 |
| Inupiat | 0.1 /100 | #296 | Tragic $47,281 |
| Dominicans | 0.1 /100 | #297 | Tragic $47,204 |
| Immigrants | Micronesia | 0.1 /100 | #298 | Tragic $47,177 |
| Immigrants | Zaire | 0.1 /100 | #299 | Tragic $47,070 |
| U.S. Virgin Islanders | 0.1 /100 | #300 | Tragic $47,066 |
| Immigrants | Latin America | 0.1 /100 | #301 | Tragic $46,941 |
| Seminole | 0.1 /100 | #302 | Tragic $46,783 |
| Yaqui | 0.1 /100 | #303 | Tragic $46,777 |
| Bangladeshis | 0.1 /100 | #304 | Tragic $46,744 |
| Guatemalans | 0.0 /100 | #305 | Tragic $46,736 |
| Dutch West Indians | 0.0 /100 | #306 | Tragic $46,656 |
| Immigrants | Dominican Republic | 0.0 /100 | #307 | Tragic $46,655 |
| Ottawa | 0.0 /100 | #308 | Tragic $46,611 |
| Creek | 0.0 /100 | #309 | Tragic $46,594 |
| Cubans | 0.0 /100 | #310 | Tragic $46,580 |
| Apache | 0.0 /100 | #311 | Tragic $46,429 |
| Hispanics or Latinos | 0.0 /100 | #312 | Tragic $46,419 |
| Hondurans | 0.0 /100 | #313 | Tragic $46,374 |