Indonesian vs Lebanese Per Capita Income
COMPARE
Indonesian
Lebanese
Per Capita Income
Per Capita Income Comparison
Indonesians
Lebanese
$37,300
PER CAPITA INCOME
0.1/ 100
METRIC RATING
296th/ 347
METRIC RANK
$45,840
PER CAPITA INCOME
92.0/ 100
METRIC RATING
123rd/ 347
METRIC RANK
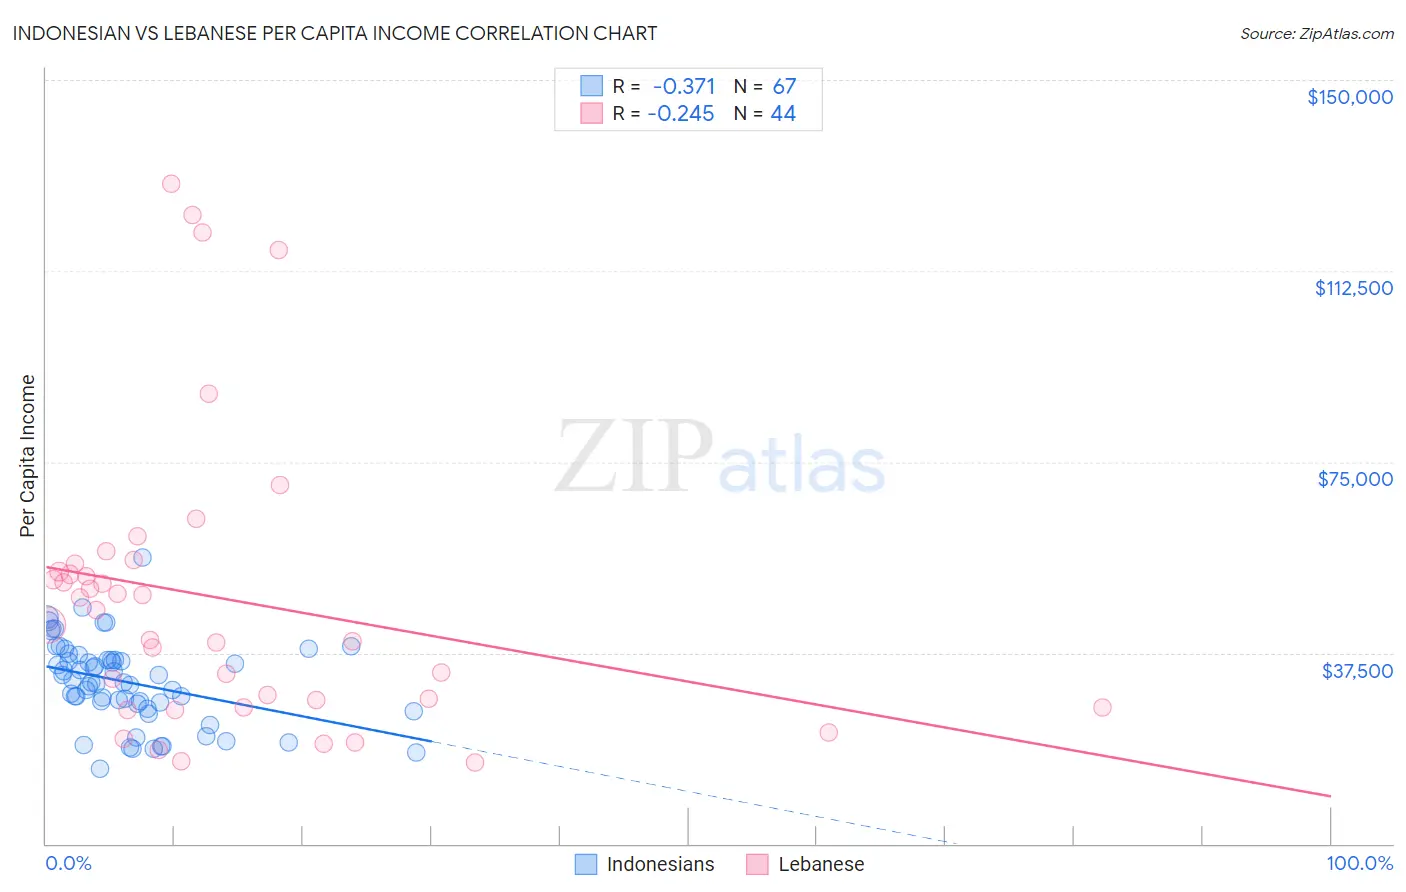
Indonesian vs Lebanese Per Capita Income Correlation Chart
The statistical analysis conducted on geographies consisting of 162,740,842 people shows a mild negative correlation between the proportion of Indonesians and per capita income in the United States with a correlation coefficient (R) of -0.371 and weighted average of $37,300. Similarly, the statistical analysis conducted on geographies consisting of 401,645,404 people shows a weak negative correlation between the proportion of Lebanese and per capita income in the United States with a correlation coefficient (R) of -0.245 and weighted average of $45,840, a difference of 22.9%.
Per Capita Income Correlation Summary
| Measurement | Indonesian | Lebanese |
| Minimum | $14,779 | $15,839 |
| Maximum | $56,163 | $129,581 |
| Range | $41,384 | $113,742 |
| Mean | $31,679 | $48,201 |
| Median | $31,763 | $44,395 |
| Interquartile 25% (IQ1) | $27,405 | $27,415 |
| Interquartile 75% (IQ3) | $36,017 | $54,286 |
| Interquartile Range (IQR) | $8,612 | $26,871 |
| Standard Deviation (Sample) | $8,209 | $28,531 |
| Standard Deviation (Population) | $8,147 | $28,205 |
Similar Demographics by Per Capita Income
Demographics Similar to Indonesians by Per Capita Income
In terms of per capita income, the demographic groups most similar to Indonesians are Immigrants from Dominican Republic ($37,306, a difference of 0.020%), Haitian ($37,289, a difference of 0.030%), Immigrants from Caribbean ($37,254, a difference of 0.12%), Cuban ($37,383, a difference of 0.22%), and Cherokee ($37,203, a difference of 0.26%).
| Demographics | Rating | Rank | Per Capita Income |
| U.S. Virgin Islanders | 0.1 /100 | #289 | Tragic $37,589 |
| Immigrants | Guatemala | 0.1 /100 | #290 | Tragic $37,550 |
| Cajuns | 0.1 /100 | #291 | Tragic $37,527 |
| Immigrants | Micronesia | 0.1 /100 | #292 | Tragic $37,464 |
| Mexican American Indians | 0.1 /100 | #293 | Tragic $37,407 |
| Cubans | 0.1 /100 | #294 | Tragic $37,383 |
| Immigrants | Dominican Republic | 0.1 /100 | #295 | Tragic $37,306 |
| Indonesians | 0.1 /100 | #296 | Tragic $37,300 |
| Haitians | 0.1 /100 | #297 | Tragic $37,289 |
| Immigrants | Caribbean | 0.1 /100 | #298 | Tragic $37,254 |
| Cherokee | 0.1 /100 | #299 | Tragic $37,203 |
| Immigrants | Bahamas | 0.1 /100 | #300 | Tragic $37,193 |
| Ottawa | 0.1 /100 | #301 | Tragic $37,101 |
| Shoshone | 0.1 /100 | #302 | Tragic $37,072 |
| Paiute | 0.1 /100 | #303 | Tragic $37,066 |
Demographics Similar to Lebanese by Per Capita Income
In terms of per capita income, the demographic groups most similar to Lebanese are European ($45,836, a difference of 0.010%), Moroccan ($45,854, a difference of 0.030%), Canadian ($45,858, a difference of 0.040%), Zimbabwean ($45,804, a difference of 0.080%), and Palestinian ($45,790, a difference of 0.11%).
| Demographics | Rating | Rank | Per Capita Income |
| Poles | 94.1 /100 | #116 | Exceptional $46,123 |
| Chinese | 93.9 /100 | #117 | Exceptional $46,098 |
| Immigrants | Saudi Arabia | 93.3 /100 | #118 | Exceptional $46,008 |
| Immigrants | Poland | 93.1 /100 | #119 | Exceptional $45,979 |
| Immigrants | Ethiopia | 92.7 /100 | #120 | Exceptional $45,923 |
| Canadians | 92.2 /100 | #121 | Exceptional $45,858 |
| Moroccans | 92.1 /100 | #122 | Exceptional $45,854 |
| Lebanese | 92.0 /100 | #123 | Exceptional $45,840 |
| Europeans | 92.0 /100 | #124 | Exceptional $45,836 |
| Zimbabweans | 91.7 /100 | #125 | Exceptional $45,804 |
| Palestinians | 91.6 /100 | #126 | Exceptional $45,790 |
| Immigrants | Germany | 91.3 /100 | #127 | Exceptional $45,751 |
| Swedes | 91.3 /100 | #128 | Exceptional $45,750 |
| Luxembourgers | 90.4 /100 | #129 | Exceptional $45,663 |
| Arabs | 90.4 /100 | #130 | Exceptional $45,662 |