Indian (Asian) vs Irish Householder Income Ages 45 - 64 years
COMPARE
Indian (Asian)
Irish
Householder Income Ages 45 - 64 years
Householder Income Ages 45 - 64 years Comparison
Indians (Asian)
Irish
$122,343
HOUSEHOLDER INCOME AGES 45 - 64 YEARS
100.0/ 100
METRIC RATING
14th/ 347
METRIC RANK
$103,067
HOUSEHOLDER INCOME AGES 45 - 64 YEARS
79.8/ 100
METRIC RATING
152nd/ 347
METRIC RANK
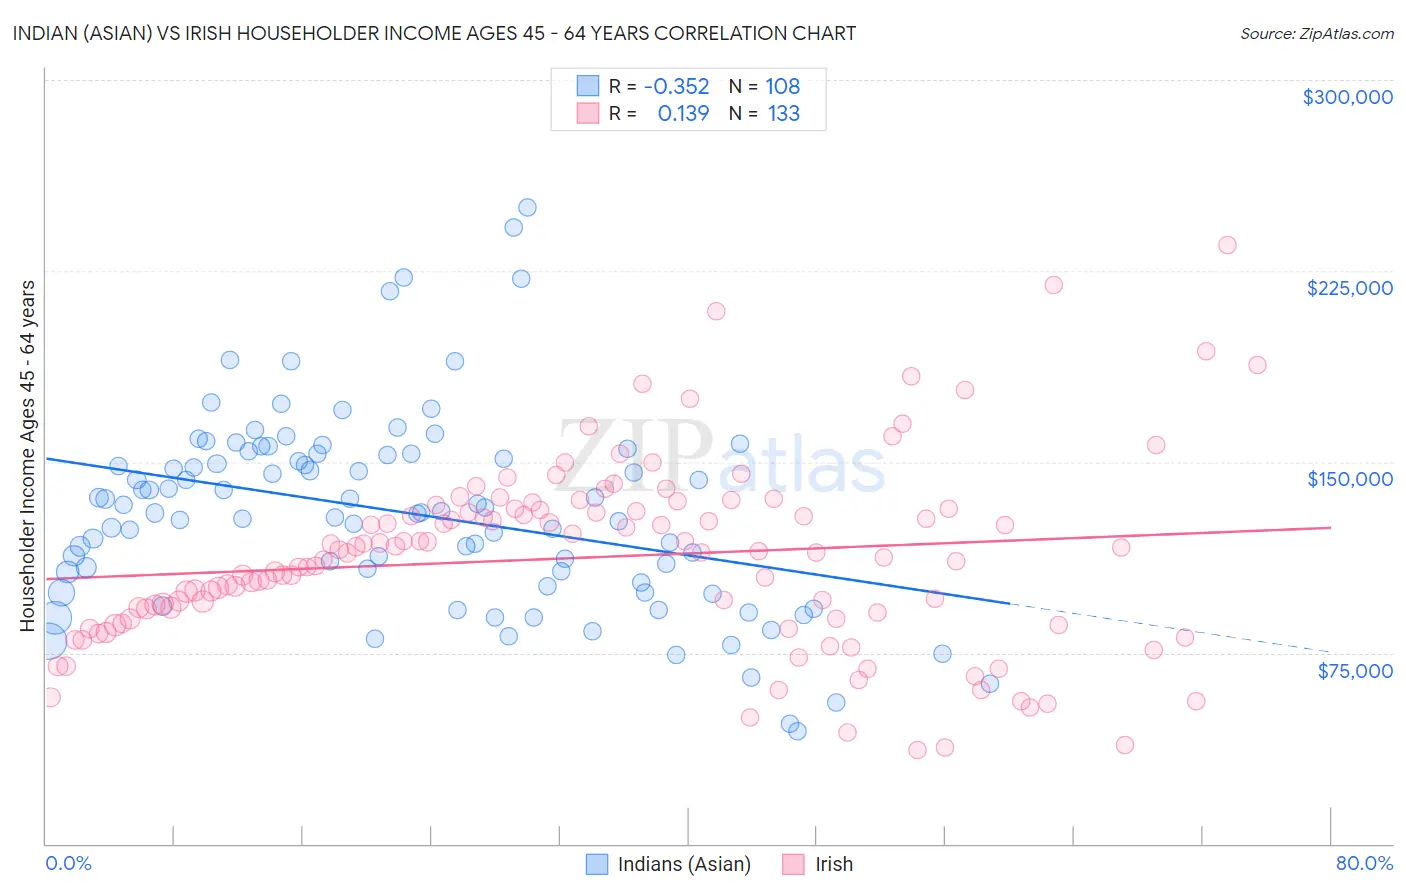
Indian (Asian) vs Irish Householder Income Ages 45 - 64 years Correlation Chart
The statistical analysis conducted on geographies consisting of 493,767,636 people shows a mild negative correlation between the proportion of Indians (Asian) and household income with householder between the ages 45 and 64 in the United States with a correlation coefficient (R) of -0.352 and weighted average of $122,343. Similarly, the statistical analysis conducted on geographies consisting of 575,418,990 people shows a poor positive correlation between the proportion of Irish and household income with householder between the ages 45 and 64 in the United States with a correlation coefficient (R) of 0.139 and weighted average of $103,067, a difference of 18.7%.
Householder Income Ages 45 - 64 years Correlation Summary
| Measurement | Indian (Asian) | Irish |
| Minimum | $44,167 | $36,603 |
| Maximum | $250,001 | $235,114 |
| Range | $205,834 | $198,511 |
| Mean | $130,085 | $112,465 |
| Median | $130,239 | $114,544 |
| Interquartile 25% (IQ1) | $104,628 | $88,235 |
| Interquartile 75% (IQ3) | $152,944 | $131,325 |
| Interquartile Range (IQR) | $48,316 | $43,090 |
| Standard Deviation (Sample) | $38,442 | $36,410 |
| Standard Deviation (Population) | $38,264 | $36,273 |
Similar Demographics by Householder Income Ages 45 - 64 years
Demographics Similar to Indians (Asian) by Householder Income Ages 45 - 64 years
In terms of householder income ages 45 - 64 years, the demographic groups most similar to Indians (Asian) are Immigrants from Eastern Asia ($122,222, a difference of 0.10%), Immigrants from China ($122,178, a difference of 0.14%), Immigrants from Ireland ($122,757, a difference of 0.34%), Immigrants from Israel ($122,893, a difference of 0.45%), and Burmese ($121,444, a difference of 0.74%).
| Demographics | Rating | Rank | Householder Income Ages 45 - 64 years |
| Immigrants | Hong Kong | 100.0 /100 | #7 | Exceptional $127,500 |
| Immigrants | Iran | 100.0 /100 | #8 | Exceptional $126,940 |
| Okinawans | 100.0 /100 | #9 | Exceptional $124,796 |
| Immigrants | South Central Asia | 100.0 /100 | #10 | Exceptional $124,188 |
| Cypriots | 100.0 /100 | #11 | Exceptional $123,396 |
| Immigrants | Israel | 100.0 /100 | #12 | Exceptional $122,893 |
| Immigrants | Ireland | 100.0 /100 | #13 | Exceptional $122,757 |
| Indians (Asian) | 100.0 /100 | #14 | Exceptional $122,343 |
| Immigrants | Eastern Asia | 100.0 /100 | #15 | Exceptional $122,222 |
| Immigrants | China | 100.0 /100 | #16 | Exceptional $122,178 |
| Burmese | 100.0 /100 | #17 | Exceptional $121,444 |
| Immigrants | Korea | 100.0 /100 | #18 | Exceptional $121,243 |
| Eastern Europeans | 100.0 /100 | #19 | Exceptional $120,684 |
| Immigrants | Australia | 100.0 /100 | #20 | Exceptional $119,308 |
| Immigrants | Sri Lanka | 100.0 /100 | #21 | Exceptional $119,094 |
Demographics Similar to Irish by Householder Income Ages 45 - 64 years
In terms of householder income ages 45 - 64 years, the demographic groups most similar to Irish are Swiss ($103,071, a difference of 0.0%), Scandinavian ($102,969, a difference of 0.090%), Immigrants from Peru ($103,173, a difference of 0.10%), Immigrants from Sierra Leone ($103,227, a difference of 0.16%), and Slovene ($102,885, a difference of 0.18%).
| Demographics | Rating | Rank | Householder Income Ages 45 - 64 years |
| Ugandans | 82.9 /100 | #145 | Excellent $103,472 |
| Immigrants | Chile | 82.5 /100 | #146 | Excellent $103,412 |
| Basques | 82.3 /100 | #147 | Excellent $103,387 |
| Immigrants | Germany | 81.5 /100 | #148 | Excellent $103,282 |
| Immigrants | Sierra Leone | 81.1 /100 | #149 | Excellent $103,227 |
| Immigrants | Peru | 80.7 /100 | #150 | Excellent $103,173 |
| Swiss | 79.9 /100 | #151 | Good $103,071 |
| Irish | 79.8 /100 | #152 | Good $103,067 |
| Scandinavians | 79.0 /100 | #153 | Good $102,969 |
| Slovenes | 78.3 /100 | #154 | Good $102,885 |
| Costa Ricans | 77.4 /100 | #155 | Good $102,779 |
| Carpatho Rusyns | 77.4 /100 | #156 | Good $102,777 |
| Immigrants | Ethiopia | 77.3 /100 | #157 | Good $102,763 |
| Slavs | 76.1 /100 | #158 | Good $102,629 |
| Sierra Leoneans | 74.2 /100 | #159 | Good $102,427 |