Seminole vs Irish Householder Income Ages 45 - 64 years
COMPARE
Seminole
Irish
Householder Income Ages 45 - 64 years
Householder Income Ages 45 - 64 years Comparison
Seminole
Irish
$80,077
HOUSEHOLDER INCOME AGES 45 - 64 YEARS
0.0/ 100
METRIC RATING
327th/ 347
METRIC RANK
$103,067
HOUSEHOLDER INCOME AGES 45 - 64 YEARS
79.8/ 100
METRIC RATING
152nd/ 347
METRIC RANK
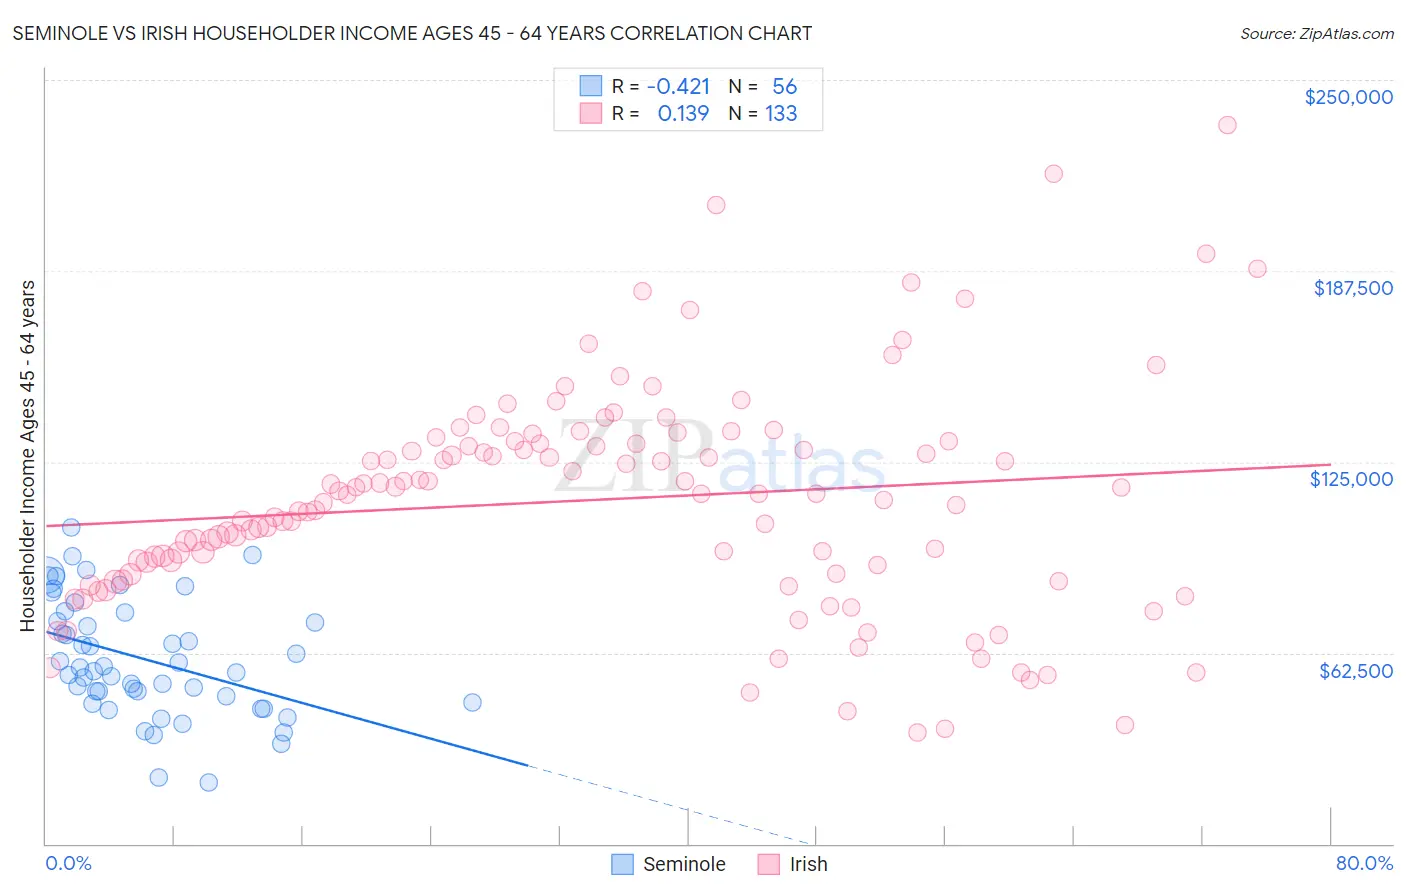
Seminole vs Irish Householder Income Ages 45 - 64 years Correlation Chart
The statistical analysis conducted on geographies consisting of 118,234,136 people shows a moderate negative correlation between the proportion of Seminole and household income with householder between the ages 45 and 64 in the United States with a correlation coefficient (R) of -0.421 and weighted average of $80,077. Similarly, the statistical analysis conducted on geographies consisting of 575,418,990 people shows a poor positive correlation between the proportion of Irish and household income with householder between the ages 45 and 64 in the United States with a correlation coefficient (R) of 0.139 and weighted average of $103,067, a difference of 28.7%.
Householder Income Ages 45 - 64 years Correlation Summary
| Measurement | Seminole | Irish |
| Minimum | $20,000 | $36,603 |
| Maximum | $103,357 | $235,114 |
| Range | $83,357 | $198,511 |
| Mean | $60,470 | $112,465 |
| Median | $57,012 | $114,544 |
| Interquartile 25% (IQ1) | $47,308 | $88,235 |
| Interquartile 75% (IQ3) | $74,206 | $131,325 |
| Interquartile Range (IQR) | $26,898 | $43,090 |
| Standard Deviation (Sample) | $19,035 | $36,410 |
| Standard Deviation (Population) | $18,864 | $36,273 |
Similar Demographics by Householder Income Ages 45 - 64 years
Demographics Similar to Seminole by Householder Income Ages 45 - 64 years
In terms of householder income ages 45 - 64 years, the demographic groups most similar to Seminole are Native/Alaskan ($79,816, a difference of 0.33%), Dominican ($80,623, a difference of 0.68%), Immigrants from Cuba ($80,662, a difference of 0.73%), Yup'ik ($81,000, a difference of 1.1%), and Dutch West Indian ($79,171, a difference of 1.1%).
| Demographics | Rating | Rank | Householder Income Ages 45 - 64 years |
| Apache | 0.0 /100 | #320 | Tragic $82,184 |
| Yuman | 0.0 /100 | #321 | Tragic $82,139 |
| Sioux | 0.0 /100 | #322 | Tragic $81,750 |
| Bahamians | 0.0 /100 | #323 | Tragic $81,369 |
| Yup'ik | 0.0 /100 | #324 | Tragic $81,000 |
| Immigrants | Cuba | 0.0 /100 | #325 | Tragic $80,662 |
| Dominicans | 0.0 /100 | #326 | Tragic $80,623 |
| Seminole | 0.0 /100 | #327 | Tragic $80,077 |
| Natives/Alaskans | 0.0 /100 | #328 | Tragic $79,816 |
| Dutch West Indians | 0.0 /100 | #329 | Tragic $79,171 |
| Creek | 0.0 /100 | #330 | Tragic $78,960 |
| Immigrants | Dominican Republic | 0.0 /100 | #331 | Tragic $78,836 |
| Blacks/African Americans | 0.0 /100 | #332 | Tragic $78,556 |
| Immigrants | Congo | 0.0 /100 | #333 | Tragic $77,850 |
| Menominee | 0.0 /100 | #334 | Tragic $76,903 |
Demographics Similar to Irish by Householder Income Ages 45 - 64 years
In terms of householder income ages 45 - 64 years, the demographic groups most similar to Irish are Swiss ($103,071, a difference of 0.0%), Scandinavian ($102,969, a difference of 0.090%), Immigrants from Peru ($103,173, a difference of 0.10%), Immigrants from Sierra Leone ($103,227, a difference of 0.16%), and Slovene ($102,885, a difference of 0.18%).
| Demographics | Rating | Rank | Householder Income Ages 45 - 64 years |
| Ugandans | 82.9 /100 | #145 | Excellent $103,472 |
| Immigrants | Chile | 82.5 /100 | #146 | Excellent $103,412 |
| Basques | 82.3 /100 | #147 | Excellent $103,387 |
| Immigrants | Germany | 81.5 /100 | #148 | Excellent $103,282 |
| Immigrants | Sierra Leone | 81.1 /100 | #149 | Excellent $103,227 |
| Immigrants | Peru | 80.7 /100 | #150 | Excellent $103,173 |
| Swiss | 79.9 /100 | #151 | Good $103,071 |
| Irish | 79.8 /100 | #152 | Good $103,067 |
| Scandinavians | 79.0 /100 | #153 | Good $102,969 |
| Slovenes | 78.3 /100 | #154 | Good $102,885 |
| Costa Ricans | 77.4 /100 | #155 | Good $102,779 |
| Carpatho Rusyns | 77.4 /100 | #156 | Good $102,777 |
| Immigrants | Ethiopia | 77.3 /100 | #157 | Good $102,763 |
| Slavs | 76.1 /100 | #158 | Good $102,629 |
| Sierra Leoneans | 74.2 /100 | #159 | Good $102,427 |