Chilean vs Irish Householder Income Ages 45 - 64 years
COMPARE
Chilean
Irish
Householder Income Ages 45 - 64 years
Householder Income Ages 45 - 64 years Comparison
Chileans
Irish
$106,611
HOUSEHOLDER INCOME AGES 45 - 64 YEARS
95.9/ 100
METRIC RATING
109th/ 347
METRIC RANK
$103,067
HOUSEHOLDER INCOME AGES 45 - 64 YEARS
79.8/ 100
METRIC RATING
152nd/ 347
METRIC RANK
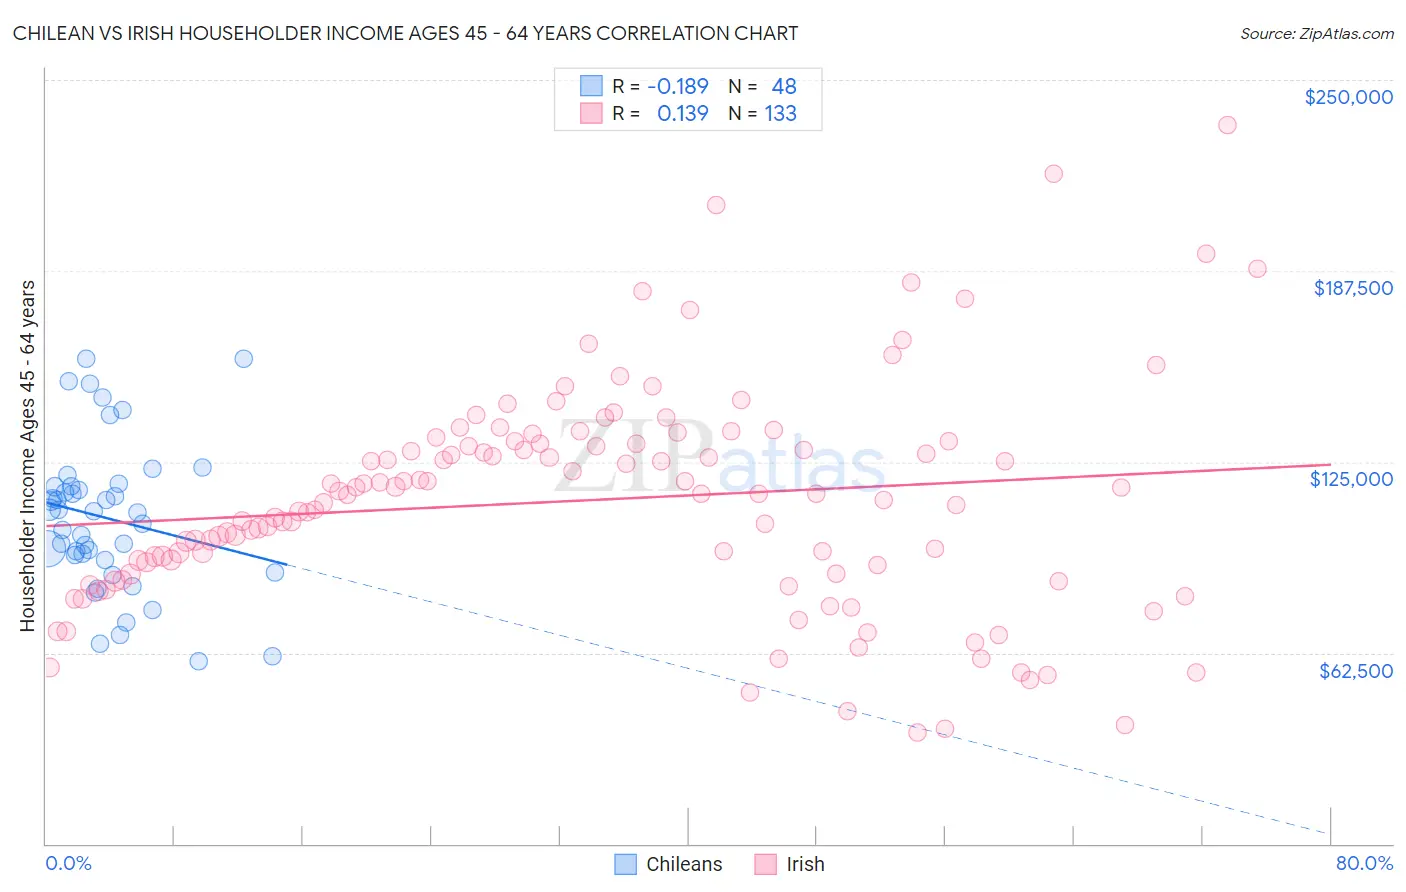
Chilean vs Irish Householder Income Ages 45 - 64 years Correlation Chart
The statistical analysis conducted on geographies consisting of 256,404,590 people shows a poor negative correlation between the proportion of Chileans and household income with householder between the ages 45 and 64 in the United States with a correlation coefficient (R) of -0.189 and weighted average of $106,611. Similarly, the statistical analysis conducted on geographies consisting of 575,418,990 people shows a poor positive correlation between the proportion of Irish and household income with householder between the ages 45 and 64 in the United States with a correlation coefficient (R) of 0.139 and weighted average of $103,067, a difference of 3.4%.
Householder Income Ages 45 - 64 years Correlation Summary
| Measurement | Chilean | Irish |
| Minimum | $59,712 | $36,603 |
| Maximum | $158,750 | $235,114 |
| Range | $99,038 | $198,511 |
| Mean | $106,575 | $112,465 |
| Median | $108,628 | $114,544 |
| Interquartile 25% (IQ1) | $93,623 | $88,235 |
| Interquartile 75% (IQ3) | $117,063 | $131,325 |
| Interquartile Range (IQR) | $23,441 | $43,090 |
| Standard Deviation (Sample) | $24,255 | $36,410 |
| Standard Deviation (Population) | $24,001 | $36,273 |
Similar Demographics by Householder Income Ages 45 - 64 years
Demographics Similar to Chileans by Householder Income Ages 45 - 64 years
In terms of householder income ages 45 - 64 years, the demographic groups most similar to Chileans are Immigrants from Brazil ($106,470, a difference of 0.13%), Immigrants from Vietnam ($106,417, a difference of 0.18%), Zimbabwean ($106,849, a difference of 0.22%), Swedish ($106,377, a difference of 0.22%), and European ($106,367, a difference of 0.23%).
| Demographics | Rating | Rank | Householder Income Ages 45 - 64 years |
| Immigrants | Moldova | 97.1 /100 | #102 | Exceptional $107,357 |
| Syrians | 96.9 /100 | #103 | Exceptional $107,207 |
| Immigrants | Ukraine | 96.7 /100 | #104 | Exceptional $107,079 |
| Macedonians | 96.7 /100 | #105 | Exceptional $107,074 |
| Armenians | 96.6 /100 | #106 | Exceptional $107,002 |
| Immigrants | Fiji | 96.5 /100 | #107 | Exceptional $106,952 |
| Zimbabweans | 96.3 /100 | #108 | Exceptional $106,849 |
| Chileans | 95.9 /100 | #109 | Exceptional $106,611 |
| Immigrants | Brazil | 95.6 /100 | #110 | Exceptional $106,470 |
| Immigrants | Vietnam | 95.5 /100 | #111 | Exceptional $106,417 |
| Swedes | 95.4 /100 | #112 | Exceptional $106,377 |
| Europeans | 95.4 /100 | #113 | Exceptional $106,367 |
| Immigrants | Poland | 95.3 /100 | #114 | Exceptional $106,319 |
| Immigrants | Kuwait | 95.2 /100 | #115 | Exceptional $106,285 |
| British | 95.2 /100 | #116 | Exceptional $106,264 |
Demographics Similar to Irish by Householder Income Ages 45 - 64 years
In terms of householder income ages 45 - 64 years, the demographic groups most similar to Irish are Swiss ($103,071, a difference of 0.0%), Scandinavian ($102,969, a difference of 0.090%), Immigrants from Peru ($103,173, a difference of 0.10%), Immigrants from Sierra Leone ($103,227, a difference of 0.16%), and Slovene ($102,885, a difference of 0.18%).
| Demographics | Rating | Rank | Householder Income Ages 45 - 64 years |
| Ugandans | 82.9 /100 | #145 | Excellent $103,472 |
| Immigrants | Chile | 82.5 /100 | #146 | Excellent $103,412 |
| Basques | 82.3 /100 | #147 | Excellent $103,387 |
| Immigrants | Germany | 81.5 /100 | #148 | Excellent $103,282 |
| Immigrants | Sierra Leone | 81.1 /100 | #149 | Excellent $103,227 |
| Immigrants | Peru | 80.7 /100 | #150 | Excellent $103,173 |
| Swiss | 79.9 /100 | #151 | Good $103,071 |
| Irish | 79.8 /100 | #152 | Good $103,067 |
| Scandinavians | 79.0 /100 | #153 | Good $102,969 |
| Slovenes | 78.3 /100 | #154 | Good $102,885 |
| Costa Ricans | 77.4 /100 | #155 | Good $102,779 |
| Carpatho Rusyns | 77.4 /100 | #156 | Good $102,777 |
| Immigrants | Ethiopia | 77.3 /100 | #157 | Good $102,763 |
| Slavs | 76.1 /100 | #158 | Good $102,629 |
| Sierra Leoneans | 74.2 /100 | #159 | Good $102,427 |