Indian (Asian) vs Immigrants from Kazakhstan Householder Income Ages 45 - 64 years
COMPARE
Indian (Asian)
Immigrants from Kazakhstan
Householder Income Ages 45 - 64 years
Householder Income Ages 45 - 64 years Comparison
Indians (Asian)
Immigrants from Kazakhstan
$122,343
HOUSEHOLDER INCOME AGES 45 - 64 YEARS
100.0/ 100
METRIC RATING
14th/ 347
METRIC RANK
$107,378
HOUSEHOLDER INCOME AGES 45 - 64 YEARS
97.2/ 100
METRIC RATING
101st/ 347
METRIC RANK
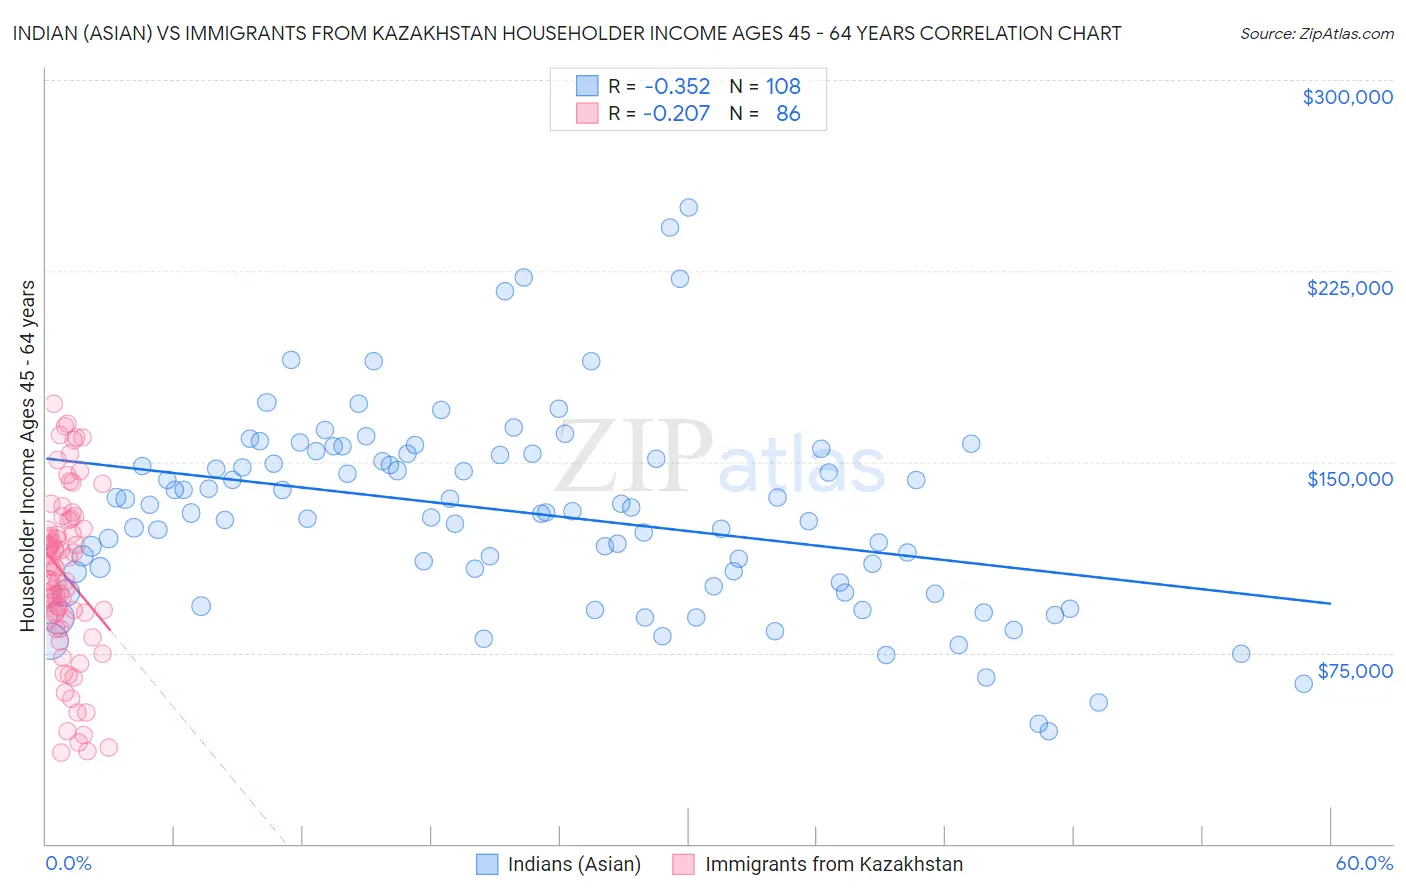
Indian (Asian) vs Immigrants from Kazakhstan Householder Income Ages 45 - 64 years Correlation Chart
The statistical analysis conducted on geographies consisting of 493,767,636 people shows a mild negative correlation between the proportion of Indians (Asian) and household income with householder between the ages 45 and 64 in the United States with a correlation coefficient (R) of -0.352 and weighted average of $122,343. Similarly, the statistical analysis conducted on geographies consisting of 124,401,740 people shows a weak negative correlation between the proportion of Immigrants from Kazakhstan and household income with householder between the ages 45 and 64 in the United States with a correlation coefficient (R) of -0.207 and weighted average of $107,378, a difference of 13.9%.
Householder Income Ages 45 - 64 years Correlation Summary
| Measurement | Indian (Asian) | Immigrants from Kazakhstan |
| Minimum | $44,167 | $35,744 |
| Maximum | $250,001 | $172,765 |
| Range | $205,834 | $137,021 |
| Mean | $130,085 | $105,299 |
| Median | $130,239 | $107,663 |
| Interquartile 25% (IQ1) | $104,628 | $88,679 |
| Interquartile 75% (IQ3) | $152,944 | $123,884 |
| Interquartile Range (IQR) | $48,316 | $35,205 |
| Standard Deviation (Sample) | $38,442 | $32,729 |
| Standard Deviation (Population) | $38,264 | $32,539 |
Similar Demographics by Householder Income Ages 45 - 64 years
Demographics Similar to Indians (Asian) by Householder Income Ages 45 - 64 years
In terms of householder income ages 45 - 64 years, the demographic groups most similar to Indians (Asian) are Immigrants from Eastern Asia ($122,222, a difference of 0.10%), Immigrants from China ($122,178, a difference of 0.14%), Immigrants from Ireland ($122,757, a difference of 0.34%), Immigrants from Israel ($122,893, a difference of 0.45%), and Burmese ($121,444, a difference of 0.74%).
| Demographics | Rating | Rank | Householder Income Ages 45 - 64 years |
| Immigrants | Hong Kong | 100.0 /100 | #7 | Exceptional $127,500 |
| Immigrants | Iran | 100.0 /100 | #8 | Exceptional $126,940 |
| Okinawans | 100.0 /100 | #9 | Exceptional $124,796 |
| Immigrants | South Central Asia | 100.0 /100 | #10 | Exceptional $124,188 |
| Cypriots | 100.0 /100 | #11 | Exceptional $123,396 |
| Immigrants | Israel | 100.0 /100 | #12 | Exceptional $122,893 |
| Immigrants | Ireland | 100.0 /100 | #13 | Exceptional $122,757 |
| Indians (Asian) | 100.0 /100 | #14 | Exceptional $122,343 |
| Immigrants | Eastern Asia | 100.0 /100 | #15 | Exceptional $122,222 |
| Immigrants | China | 100.0 /100 | #16 | Exceptional $122,178 |
| Burmese | 100.0 /100 | #17 | Exceptional $121,444 |
| Immigrants | Korea | 100.0 /100 | #18 | Exceptional $121,243 |
| Eastern Europeans | 100.0 /100 | #19 | Exceptional $120,684 |
| Immigrants | Australia | 100.0 /100 | #20 | Exceptional $119,308 |
| Immigrants | Sri Lanka | 100.0 /100 | #21 | Exceptional $119,094 |
Demographics Similar to Immigrants from Kazakhstan by Householder Income Ages 45 - 64 years
In terms of householder income ages 45 - 64 years, the demographic groups most similar to Immigrants from Kazakhstan are Immigrants from Moldova ($107,357, a difference of 0.020%), Syrian ($107,207, a difference of 0.16%), Immigrants from Serbia ($107,569, a difference of 0.18%), Immigrants from Ukraine ($107,079, a difference of 0.28%), and Macedonian ($107,074, a difference of 0.28%).
| Demographics | Rating | Rank | Householder Income Ages 45 - 64 years |
| Sri Lankans | 98.2 /100 | #94 | Exceptional $108,270 |
| Immigrants | Hungary | 98.2 /100 | #95 | Exceptional $108,267 |
| Immigrants | Argentina | 98.2 /100 | #96 | Exceptional $108,264 |
| Northern Europeans | 97.8 /100 | #97 | Exceptional $107,870 |
| Immigrants | Southern Europe | 97.7 /100 | #98 | Exceptional $107,775 |
| Palestinians | 97.6 /100 | #99 | Exceptional $107,721 |
| Immigrants | Serbia | 97.4 /100 | #100 | Exceptional $107,569 |
| Immigrants | Kazakhstan | 97.2 /100 | #101 | Exceptional $107,378 |
| Immigrants | Moldova | 97.1 /100 | #102 | Exceptional $107,357 |
| Syrians | 96.9 /100 | #103 | Exceptional $107,207 |
| Immigrants | Ukraine | 96.7 /100 | #104 | Exceptional $107,079 |
| Macedonians | 96.7 /100 | #105 | Exceptional $107,074 |
| Armenians | 96.6 /100 | #106 | Exceptional $107,002 |
| Immigrants | Fiji | 96.5 /100 | #107 | Exceptional $106,952 |
| Zimbabweans | 96.3 /100 | #108 | Exceptional $106,849 |