Sudanese vs Irish Householder Income Ages 45 - 64 years
COMPARE
Sudanese
Irish
Householder Income Ages 45 - 64 years
Householder Income Ages 45 - 64 years Comparison
Sudanese
Irish
$93,718
HOUSEHOLDER INCOME AGES 45 - 64 YEARS
3.5/ 100
METRIC RATING
232nd/ 347
METRIC RANK
$103,067
HOUSEHOLDER INCOME AGES 45 - 64 YEARS
79.8/ 100
METRIC RATING
152nd/ 347
METRIC RANK
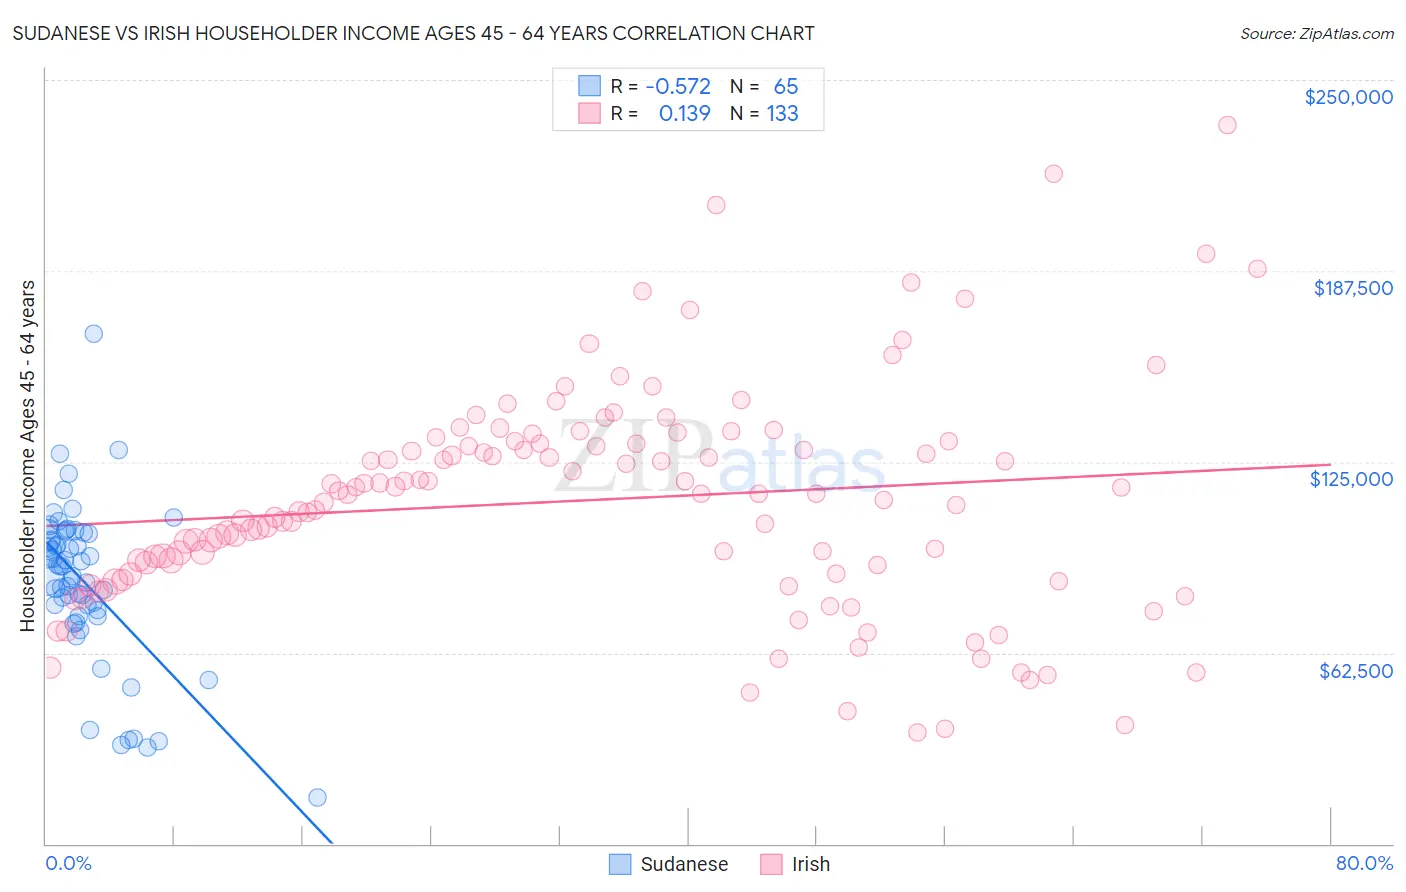
Sudanese vs Irish Householder Income Ages 45 - 64 years Correlation Chart
The statistical analysis conducted on geographies consisting of 110,067,983 people shows a substantial negative correlation between the proportion of Sudanese and household income with householder between the ages 45 and 64 in the United States with a correlation coefficient (R) of -0.572 and weighted average of $93,718. Similarly, the statistical analysis conducted on geographies consisting of 575,418,990 people shows a poor positive correlation between the proportion of Irish and household income with householder between the ages 45 and 64 in the United States with a correlation coefficient (R) of 0.139 and weighted average of $103,067, a difference of 10.0%.
Householder Income Ages 45 - 64 years Correlation Summary
| Measurement | Sudanese | Irish |
| Minimum | $15,339 | $36,603 |
| Maximum | $167,134 | $235,114 |
| Range | $151,795 | $198,511 |
| Mean | $85,566 | $112,465 |
| Median | $90,864 | $114,544 |
| Interquartile 25% (IQ1) | $75,524 | $88,235 |
| Interquartile 75% (IQ3) | $101,575 | $131,325 |
| Interquartile Range (IQR) | $26,051 | $43,090 |
| Standard Deviation (Sample) | $26,171 | $36,410 |
| Standard Deviation (Population) | $25,969 | $36,273 |
Similar Demographics by Householder Income Ages 45 - 64 years
Demographics Similar to Sudanese by Householder Income Ages 45 - 64 years
In terms of householder income ages 45 - 64 years, the demographic groups most similar to Sudanese are Ecuadorian ($93,739, a difference of 0.020%), Vietnamese ($93,788, a difference of 0.070%), Immigrants from Sudan ($93,781, a difference of 0.070%), Immigrants from Panama ($93,815, a difference of 0.10%), and Alaska Native ($93,991, a difference of 0.29%).
| Demographics | Rating | Rank | Householder Income Ages 45 - 64 years |
| Bermudans | 4.4 /100 | #225 | Tragic $94,197 |
| Immigrants | Azores | 4.3 /100 | #226 | Tragic $94,138 |
| Alaska Natives | 4.0 /100 | #227 | Tragic $93,991 |
| Immigrants | Panama | 3.7 /100 | #228 | Tragic $93,815 |
| Vietnamese | 3.6 /100 | #229 | Tragic $93,788 |
| Immigrants | Sudan | 3.6 /100 | #230 | Tragic $93,781 |
| Ecuadorians | 3.6 /100 | #231 | Tragic $93,739 |
| Sudanese | 3.5 /100 | #232 | Tragic $93,718 |
| Nepalese | 3.0 /100 | #233 | Tragic $93,355 |
| Immigrants | El Salvador | 2.7 /100 | #234 | Tragic $93,176 |
| Nicaraguans | 2.0 /100 | #235 | Tragic $92,554 |
| Immigrants | Western Africa | 1.8 /100 | #236 | Tragic $92,384 |
| Immigrants | Bangladesh | 1.7 /100 | #237 | Tragic $92,208 |
| Pennsylvania Germans | 1.5 /100 | #238 | Tragic $91,956 |
| Immigrants | Ecuador | 1.2 /100 | #239 | Tragic $91,462 |
Demographics Similar to Irish by Householder Income Ages 45 - 64 years
In terms of householder income ages 45 - 64 years, the demographic groups most similar to Irish are Swiss ($103,071, a difference of 0.0%), Scandinavian ($102,969, a difference of 0.090%), Immigrants from Peru ($103,173, a difference of 0.10%), Immigrants from Sierra Leone ($103,227, a difference of 0.16%), and Slovene ($102,885, a difference of 0.18%).
| Demographics | Rating | Rank | Householder Income Ages 45 - 64 years |
| Ugandans | 82.9 /100 | #145 | Excellent $103,472 |
| Immigrants | Chile | 82.5 /100 | #146 | Excellent $103,412 |
| Basques | 82.3 /100 | #147 | Excellent $103,387 |
| Immigrants | Germany | 81.5 /100 | #148 | Excellent $103,282 |
| Immigrants | Sierra Leone | 81.1 /100 | #149 | Excellent $103,227 |
| Immigrants | Peru | 80.7 /100 | #150 | Excellent $103,173 |
| Swiss | 79.9 /100 | #151 | Good $103,071 |
| Irish | 79.8 /100 | #152 | Good $103,067 |
| Scandinavians | 79.0 /100 | #153 | Good $102,969 |
| Slovenes | 78.3 /100 | #154 | Good $102,885 |
| Costa Ricans | 77.4 /100 | #155 | Good $102,779 |
| Carpatho Rusyns | 77.4 /100 | #156 | Good $102,777 |
| Immigrants | Ethiopia | 77.3 /100 | #157 | Good $102,763 |
| Slavs | 76.1 /100 | #158 | Good $102,629 |
| Sierra Leoneans | 74.2 /100 | #159 | Good $102,427 |