Indian (Asian) vs Immigrants from Kazakhstan Per Capita Income
COMPARE
Indian (Asian)
Immigrants from Kazakhstan
Per Capita Income
Per Capita Income Comparison
Indians (Asian)
Immigrants from Kazakhstan
$53,874
PER CAPITA INCOME
100.0/ 100
METRIC RATING
22nd/ 347
METRIC RANK
$48,747
PER CAPITA INCOME
99.7/ 100
METRIC RATING
77th/ 347
METRIC RANK
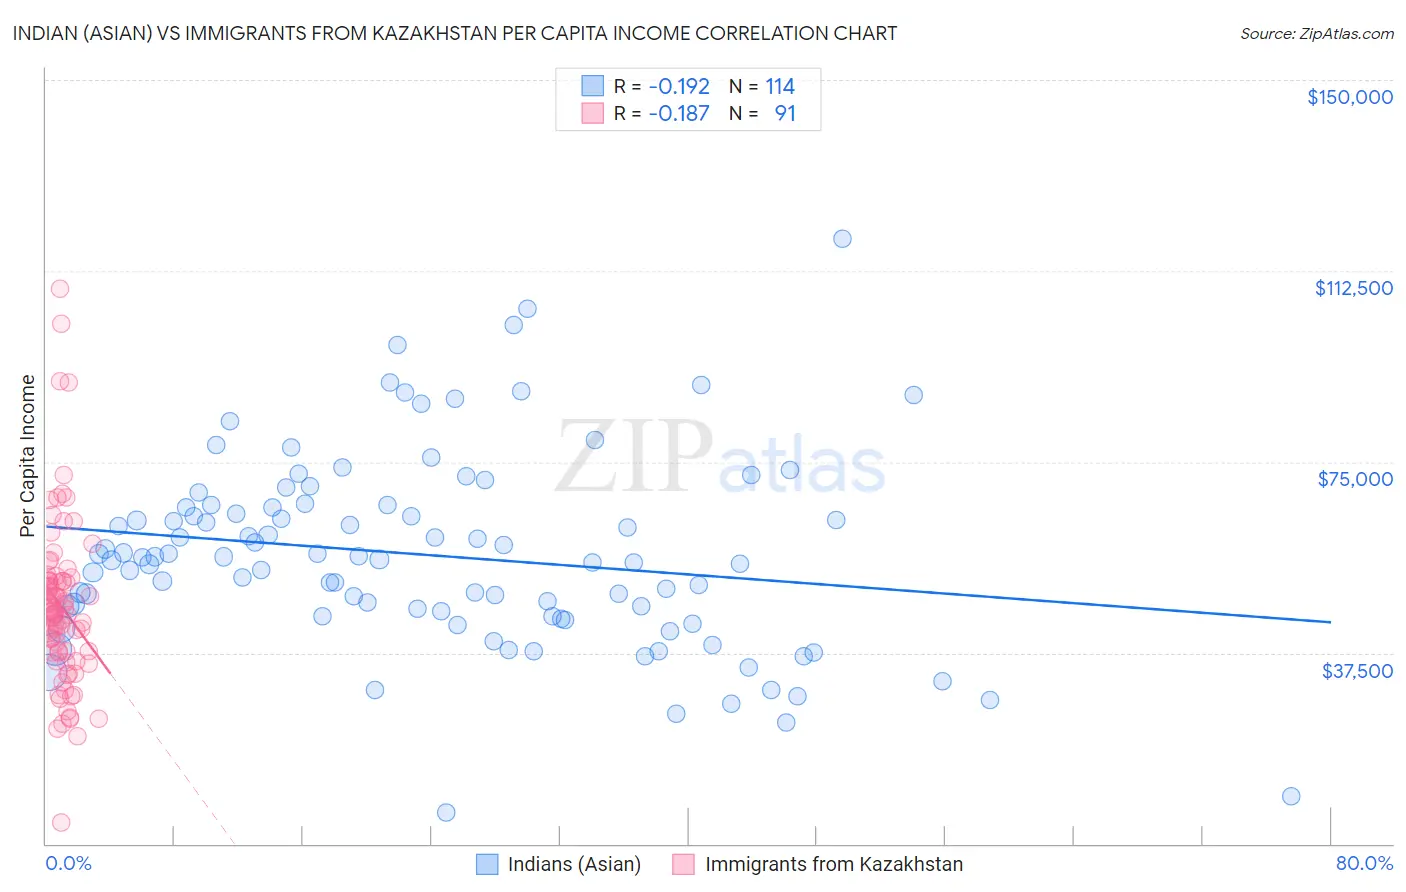
Indian (Asian) vs Immigrants from Kazakhstan Per Capita Income Correlation Chart
The statistical analysis conducted on geographies consisting of 495,399,283 people shows a poor negative correlation between the proportion of Indians (Asian) and per capita income in the United States with a correlation coefficient (R) of -0.192 and weighted average of $53,874. Similarly, the statistical analysis conducted on geographies consisting of 124,442,915 people shows a poor negative correlation between the proportion of Immigrants from Kazakhstan and per capita income in the United States with a correlation coefficient (R) of -0.187 and weighted average of $48,747, a difference of 10.5%.
Per Capita Income Correlation Summary
| Measurement | Indian (Asian) | Immigrants from Kazakhstan |
| Minimum | $6,086 | $4,252 |
| Maximum | $118,834 | $109,103 |
| Range | $112,748 | $104,851 |
| Mean | $56,707 | $46,679 |
| Median | $56,072 | $45,620 |
| Interquartile 25% (IQ1) | $44,771 | $37,540 |
| Interquartile 75% (IQ3) | $66,146 | $51,665 |
| Interquartile Range (IQR) | $21,374 | $14,125 |
| Standard Deviation (Sample) | $19,017 | $16,400 |
| Standard Deviation (Population) | $18,934 | $16,310 |
Similar Demographics by Per Capita Income
Demographics Similar to Indians (Asian) by Per Capita Income
In terms of per capita income, the demographic groups most similar to Indians (Asian) are Immigrants from Eastern Asia ($53,806, a difference of 0.13%), Immigrants from Denmark ($53,799, a difference of 0.14%), Immigrants from Northern Europe ($54,159, a difference of 0.53%), Soviet Union ($54,202, a difference of 0.61%), and Immigrants from China ($54,264, a difference of 0.72%).
| Demographics | Rating | Rank | Per Capita Income |
| Cypriots | 100.0 /100 | #15 | Exceptional $54,899 |
| Immigrants | Switzerland | 100.0 /100 | #16 | Exceptional $54,866 |
| Immigrants | France | 100.0 /100 | #17 | Exceptional $54,557 |
| Thais | 100.0 /100 | #18 | Exceptional $54,307 |
| Immigrants | China | 100.0 /100 | #19 | Exceptional $54,264 |
| Soviet Union | 100.0 /100 | #20 | Exceptional $54,202 |
| Immigrants | Northern Europe | 100.0 /100 | #21 | Exceptional $54,159 |
| Indians (Asian) | 100.0 /100 | #22 | Exceptional $53,874 |
| Immigrants | Eastern Asia | 100.0 /100 | #23 | Exceptional $53,806 |
| Immigrants | Denmark | 100.0 /100 | #24 | Exceptional $53,799 |
| Immigrants | Japan | 100.0 /100 | #25 | Exceptional $53,359 |
| Russians | 100.0 /100 | #26 | Exceptional $53,154 |
| Immigrants | South Central Asia | 100.0 /100 | #27 | Exceptional $52,660 |
| Latvians | 100.0 /100 | #28 | Exceptional $52,649 |
| Israelis | 100.0 /100 | #29 | Exceptional $52,596 |
Demographics Similar to Immigrants from Kazakhstan by Per Capita Income
In terms of per capita income, the demographic groups most similar to Immigrants from Kazakhstan are Immigrants from Italy ($48,654, a difference of 0.19%), Immigrants from England ($48,844, a difference of 0.20%), Immigrants from Bolivia ($48,970, a difference of 0.46%), Romanian ($48,445, a difference of 0.62%), and Egyptian ($48,358, a difference of 0.80%).
| Demographics | Rating | Rank | Per Capita Income |
| Immigrants | Eastern Europe | 99.8 /100 | #70 | Exceptional $49,316 |
| Greeks | 99.8 /100 | #71 | Exceptional $49,309 |
| Immigrants | Hungary | 99.8 /100 | #72 | Exceptional $49,303 |
| Immigrants | North America | 99.8 /100 | #73 | Exceptional $49,302 |
| Mongolians | 99.8 /100 | #74 | Exceptional $49,173 |
| Immigrants | Bolivia | 99.7 /100 | #75 | Exceptional $48,970 |
| Immigrants | England | 99.7 /100 | #76 | Exceptional $48,844 |
| Immigrants | Kazakhstan | 99.7 /100 | #77 | Exceptional $48,747 |
| Immigrants | Italy | 99.6 /100 | #78 | Exceptional $48,654 |
| Romanians | 99.5 /100 | #79 | Exceptional $48,445 |
| Egyptians | 99.5 /100 | #80 | Exceptional $48,358 |
| Armenians | 99.4 /100 | #81 | Exceptional $48,287 |
| Immigrants | Indonesia | 99.4 /100 | #82 | Exceptional $48,195 |
| Immigrants | Brazil | 99.4 /100 | #83 | Exceptional $48,164 |
| Immigrants | Ukraine | 99.3 /100 | #84 | Exceptional $48,134 |