Liberian vs Immigrants from Kazakhstan Householder Income Ages 45 - 64 years
COMPARE
Liberian
Immigrants from Kazakhstan
Householder Income Ages 45 - 64 years
Householder Income Ages 45 - 64 years Comparison
Liberians
Immigrants from Kazakhstan
$88,929
HOUSEHOLDER INCOME AGES 45 - 64 YEARS
0.3/ 100
METRIC RATING
260th/ 347
METRIC RANK
$107,378
HOUSEHOLDER INCOME AGES 45 - 64 YEARS
97.2/ 100
METRIC RATING
101st/ 347
METRIC RANK
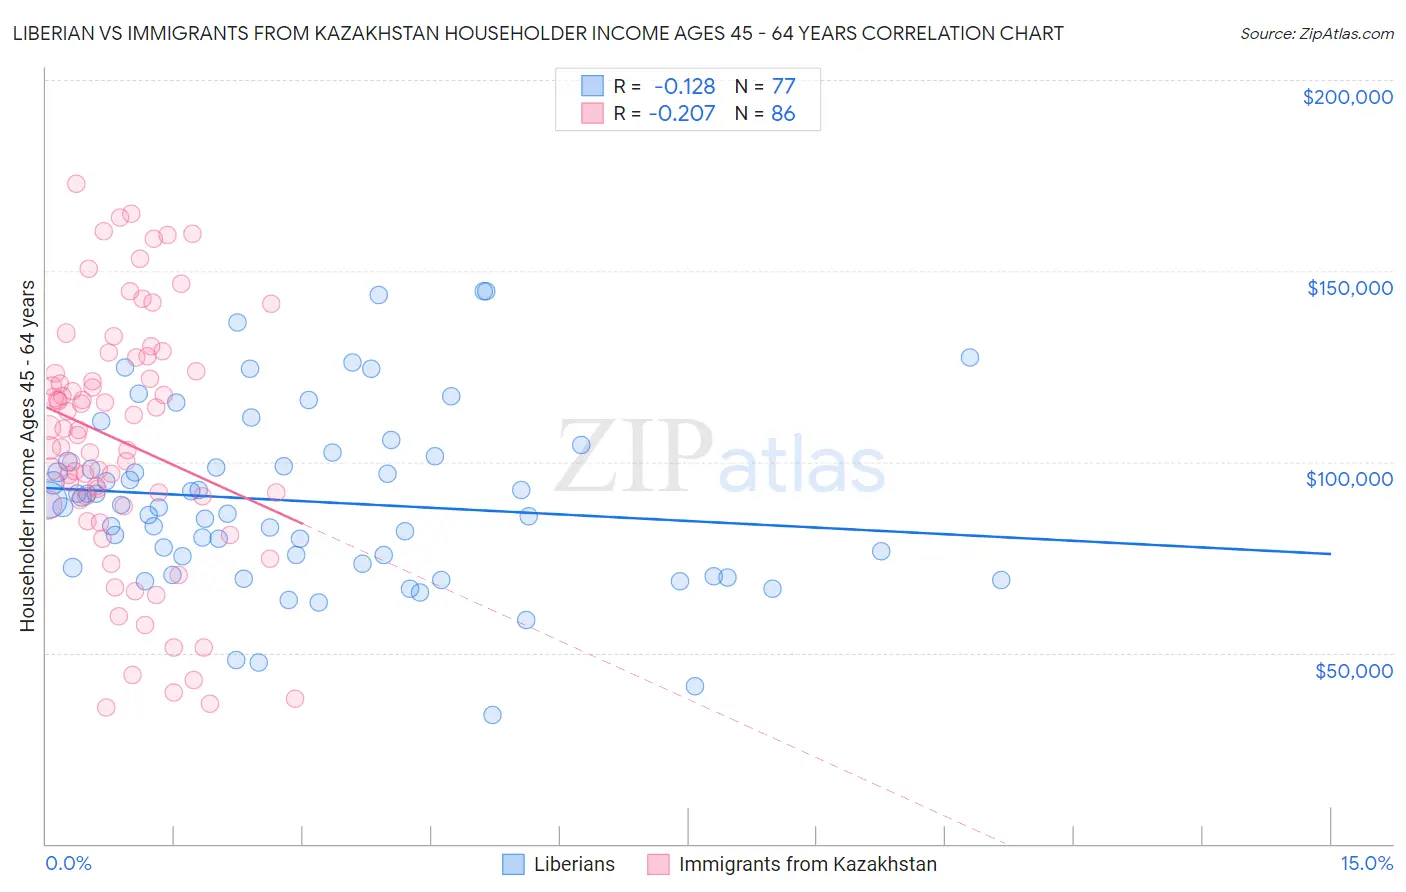
Liberian vs Immigrants from Kazakhstan Householder Income Ages 45 - 64 years Correlation Chart
The statistical analysis conducted on geographies consisting of 117,988,701 people shows a poor negative correlation between the proportion of Liberians and household income with householder between the ages 45 and 64 in the United States with a correlation coefficient (R) of -0.128 and weighted average of $88,929. Similarly, the statistical analysis conducted on geographies consisting of 124,401,740 people shows a weak negative correlation between the proportion of Immigrants from Kazakhstan and household income with householder between the ages 45 and 64 in the United States with a correlation coefficient (R) of -0.207 and weighted average of $107,378, a difference of 20.7%.
Householder Income Ages 45 - 64 years Correlation Summary
| Measurement | Liberian | Immigrants from Kazakhstan |
| Minimum | $33,597 | $35,744 |
| Maximum | $144,731 | $172,765 |
| Range | $111,134 | $137,021 |
| Mean | $89,630 | $105,299 |
| Median | $88,174 | $107,663 |
| Interquartile 25% (IQ1) | $72,788 | $88,679 |
| Interquartile 75% (IQ3) | $100,871 | $123,884 |
| Interquartile Range (IQR) | $28,083 | $35,205 |
| Standard Deviation (Sample) | $23,274 | $32,729 |
| Standard Deviation (Population) | $23,122 | $32,539 |
Similar Demographics by Householder Income Ages 45 - 64 years
Demographics Similar to Liberians by Householder Income Ages 45 - 64 years
In terms of householder income ages 45 - 64 years, the demographic groups most similar to Liberians are Immigrants from Nicaragua ($89,108, a difference of 0.20%), Belizean ($88,684, a difference of 0.28%), Somali ($88,600, a difference of 0.37%), Immigrants from Barbados ($89,394, a difference of 0.52%), and German Russian ($89,398, a difference of 0.53%).
| Demographics | Rating | Rank | Householder Income Ages 45 - 64 years |
| Barbadians | 0.6 /100 | #253 | Tragic $90,266 |
| Immigrants | Guyana | 0.6 /100 | #254 | Tragic $90,186 |
| West Indians | 0.5 /100 | #255 | Tragic $89,906 |
| French American Indians | 0.5 /100 | #256 | Tragic $89,811 |
| German Russians | 0.4 /100 | #257 | Tragic $89,398 |
| Immigrants | Barbados | 0.4 /100 | #258 | Tragic $89,394 |
| Immigrants | Nicaragua | 0.4 /100 | #259 | Tragic $89,108 |
| Liberians | 0.3 /100 | #260 | Tragic $88,929 |
| Belizeans | 0.3 /100 | #261 | Tragic $88,684 |
| Somalis | 0.3 /100 | #262 | Tragic $88,600 |
| Immigrants | Senegal | 0.3 /100 | #263 | Tragic $88,421 |
| Osage | 0.3 /100 | #264 | Tragic $88,390 |
| Jamaicans | 0.2 /100 | #265 | Tragic $88,327 |
| Immigrants | West Indies | 0.2 /100 | #266 | Tragic $88,164 |
| Hmong | 0.2 /100 | #267 | Tragic $88,115 |
Demographics Similar to Immigrants from Kazakhstan by Householder Income Ages 45 - 64 years
In terms of householder income ages 45 - 64 years, the demographic groups most similar to Immigrants from Kazakhstan are Immigrants from Moldova ($107,357, a difference of 0.020%), Syrian ($107,207, a difference of 0.16%), Immigrants from Serbia ($107,569, a difference of 0.18%), Immigrants from Ukraine ($107,079, a difference of 0.28%), and Macedonian ($107,074, a difference of 0.28%).
| Demographics | Rating | Rank | Householder Income Ages 45 - 64 years |
| Sri Lankans | 98.2 /100 | #94 | Exceptional $108,270 |
| Immigrants | Hungary | 98.2 /100 | #95 | Exceptional $108,267 |
| Immigrants | Argentina | 98.2 /100 | #96 | Exceptional $108,264 |
| Northern Europeans | 97.8 /100 | #97 | Exceptional $107,870 |
| Immigrants | Southern Europe | 97.7 /100 | #98 | Exceptional $107,775 |
| Palestinians | 97.6 /100 | #99 | Exceptional $107,721 |
| Immigrants | Serbia | 97.4 /100 | #100 | Exceptional $107,569 |
| Immigrants | Kazakhstan | 97.2 /100 | #101 | Exceptional $107,378 |
| Immigrants | Moldova | 97.1 /100 | #102 | Exceptional $107,357 |
| Syrians | 96.9 /100 | #103 | Exceptional $107,207 |
| Immigrants | Ukraine | 96.7 /100 | #104 | Exceptional $107,079 |
| Macedonians | 96.7 /100 | #105 | Exceptional $107,074 |
| Armenians | 96.6 /100 | #106 | Exceptional $107,002 |
| Immigrants | Fiji | 96.5 /100 | #107 | Exceptional $106,952 |
| Zimbabweans | 96.3 /100 | #108 | Exceptional $106,849 |