Immigrants vs Puerto Rican Median Household Income
COMPARE
Immigrants
Puerto Rican
Median Household Income
Median Household Income Comparison
Immigrants
Puerto Ricans
$85,818
MEDIAN HOUSEHOLD INCOME
61.3/ 100
METRIC RATING
167th/ 347
METRIC RANK
$59,197
MEDIAN HOUSEHOLD INCOME
0.0/ 100
METRIC RATING
345th/ 347
METRIC RANK
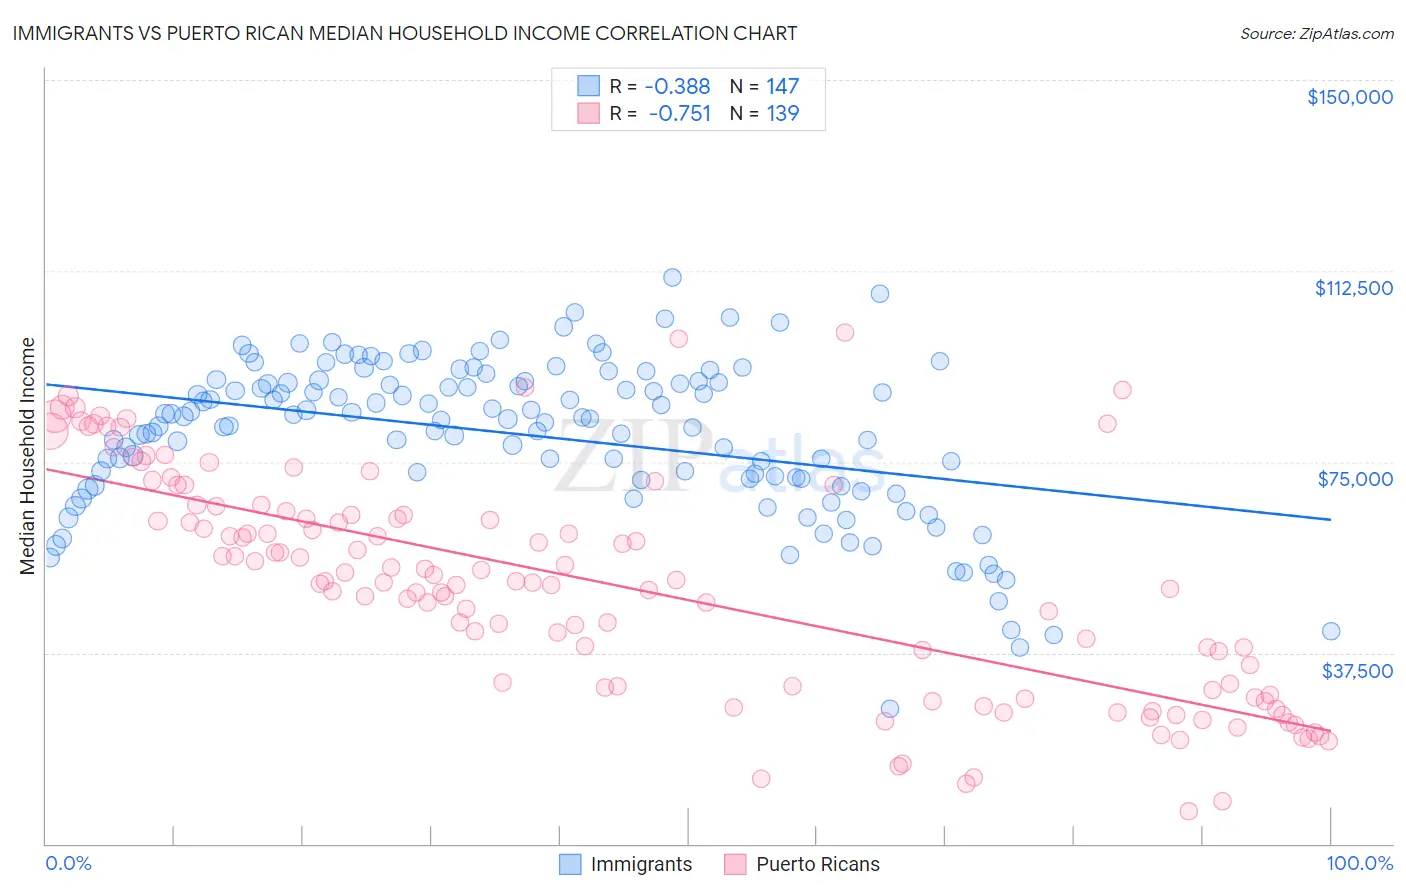
Immigrants vs Puerto Rican Median Household Income Correlation Chart
The statistical analysis conducted on geographies consisting of 575,988,831 people shows a mild negative correlation between the proportion of Immigrants and median household income in the United States with a correlation coefficient (R) of -0.388 and weighted average of $85,818. Similarly, the statistical analysis conducted on geographies consisting of 527,459,436 people shows a strong negative correlation between the proportion of Puerto Ricans and median household income in the United States with a correlation coefficient (R) of -0.751 and weighted average of $59,197, a difference of 45.0%.
Median Household Income Correlation Summary
| Measurement | Immigrants | Puerto Rican |
| Minimum | $26,558 | $6,449 |
| Maximum | $111,218 | $100,425 |
| Range | $84,660 | $93,976 |
| Mean | $80,268 | $50,898 |
| Median | $83,546 | $51,527 |
| Interquartile 25% (IQ1) | $71,664 | $30,679 |
| Interquartile 75% (IQ3) | $90,776 | $65,376 |
| Interquartile Range (IQR) | $19,112 | $34,697 |
| Standard Deviation (Sample) | $15,311 | $21,767 |
| Standard Deviation (Population) | $15,259 | $21,689 |
Similar Demographics by Median Household Income
Demographics Similar to Immigrants by Median Household Income
In terms of median household income, the demographic groups most similar to Immigrants are Icelander ($85,797, a difference of 0.020%), Colombian ($85,716, a difference of 0.12%), Swiss ($85,681, a difference of 0.16%), Immigrants from South America ($85,611, a difference of 0.24%), and Scandinavian ($86,073, a difference of 0.30%).
| Demographics | Rating | Rank | Median Household Income |
| Luxembourgers | 70.0 /100 | #160 | Good $86,418 |
| Slavs | 69.7 /100 | #161 | Good $86,398 |
| Guamanians/Chamorros | 67.7 /100 | #162 | Good $86,255 |
| Czechs | 66.4 /100 | #163 | Good $86,164 |
| Irish | 66.2 /100 | #164 | Good $86,145 |
| Norwegians | 65.3 /100 | #165 | Good $86,084 |
| Scandinavians | 65.1 /100 | #166 | Good $86,073 |
| Immigrants | Immigrants | 61.3 /100 | #167 | Good $85,818 |
| Icelanders | 61.0 /100 | #168 | Good $85,797 |
| Colombians | 59.7 /100 | #169 | Average $85,716 |
| Swiss | 59.2 /100 | #170 | Average $85,681 |
| Immigrants | South America | 58.1 /100 | #171 | Average $85,611 |
| Slovenes | 57.4 /100 | #172 | Average $85,562 |
| Immigrants | Cameroon | 53.4 /100 | #173 | Average $85,314 |
| Scottish | 50.0 /100 | #174 | Average $85,101 |
Demographics Similar to Puerto Ricans by Median Household Income
In terms of median household income, the demographic groups most similar to Puerto Ricans are Navajo ($59,159, a difference of 0.060%), Tohono O'odham ($61,663, a difference of 4.2%), Houma ($62,575, a difference of 5.7%), Pima ($63,262, a difference of 6.9%), and Crow ($63,681, a difference of 7.6%).
| Demographics | Rating | Rank | Median Household Income |
| Creek | 0.0 /100 | #333 | Tragic $67,715 |
| Blacks/African Americans | 0.0 /100 | #334 | Tragic $67,573 |
| Cheyenne | 0.0 /100 | #335 | Tragic $66,974 |
| Immigrants | Congo | 0.0 /100 | #336 | Tragic $66,768 |
| Kiowa | 0.0 /100 | #337 | Tragic $65,914 |
| Immigrants | Yemen | 0.0 /100 | #338 | Tragic $65,194 |
| Hopi | 0.0 /100 | #339 | Tragic $65,043 |
| Pueblo | 0.0 /100 | #340 | Tragic $64,692 |
| Crow | 0.0 /100 | #341 | Tragic $63,681 |
| Pima | 0.0 /100 | #342 | Tragic $63,262 |
| Houma | 0.0 /100 | #343 | Tragic $62,575 |
| Tohono O'odham | 0.0 /100 | #344 | Tragic $61,663 |
| Puerto Ricans | 0.0 /100 | #345 | Tragic $59,197 |
| Navajo | 0.0 /100 | #346 | Tragic $59,159 |
| Lumbee | 0.0 /100 | #347 | Tragic $54,644 |