Immigrants vs Nicaraguan Median Household Income
COMPARE
Immigrants
Nicaraguan
Median Household Income
Median Household Income Comparison
Immigrants
Nicaraguans
$85,818
MEDIAN HOUSEHOLD INCOME
61.3/ 100
METRIC RATING
167th/ 347
METRIC RANK
$79,737
MEDIAN HOUSEHOLD INCOME
3.1/ 100
METRIC RATING
237th/ 347
METRIC RANK
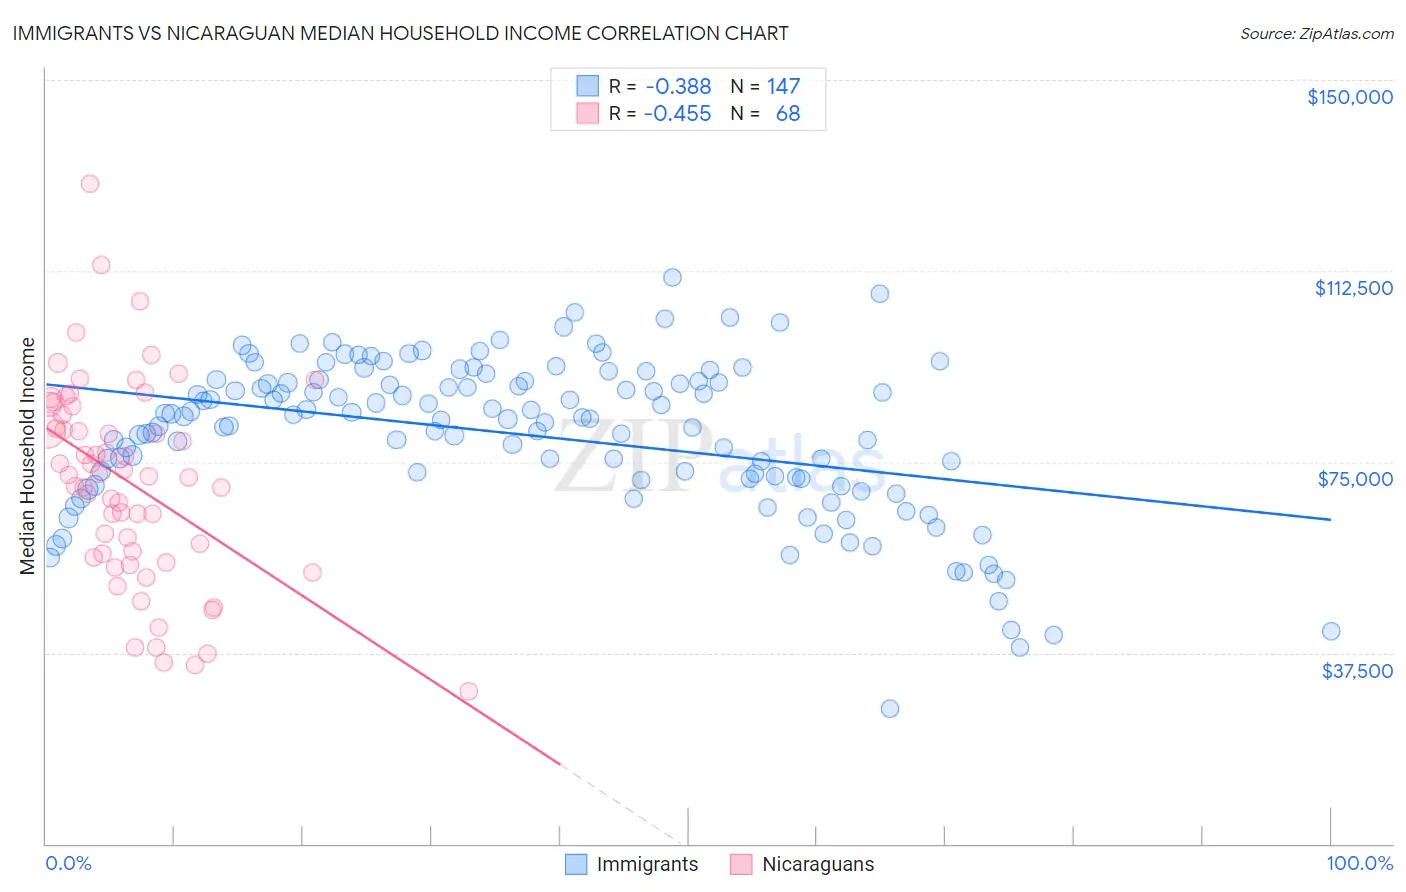
Immigrants vs Nicaraguan Median Household Income Correlation Chart
The statistical analysis conducted on geographies consisting of 575,988,831 people shows a mild negative correlation between the proportion of Immigrants and median household income in the United States with a correlation coefficient (R) of -0.388 and weighted average of $85,818. Similarly, the statistical analysis conducted on geographies consisting of 285,567,751 people shows a moderate negative correlation between the proportion of Nicaraguans and median household income in the United States with a correlation coefficient (R) of -0.455 and weighted average of $79,737, a difference of 7.6%.
Median Household Income Correlation Summary
| Measurement | Immigrants | Nicaraguan |
| Minimum | $26,558 | $29,878 |
| Maximum | $111,218 | $129,595 |
| Range | $84,660 | $99,717 |
| Mean | $80,268 | $70,971 |
| Median | $83,546 | $72,218 |
| Interquartile 25% (IQ1) | $71,664 | $56,639 |
| Interquartile 75% (IQ3) | $90,776 | $85,047 |
| Interquartile Range (IQR) | $19,112 | $28,408 |
| Standard Deviation (Sample) | $15,311 | $19,770 |
| Standard Deviation (Population) | $15,259 | $19,624 |
Similar Demographics by Median Household Income
Demographics Similar to Immigrants by Median Household Income
In terms of median household income, the demographic groups most similar to Immigrants are Icelander ($85,797, a difference of 0.020%), Colombian ($85,716, a difference of 0.12%), Swiss ($85,681, a difference of 0.16%), Immigrants from South America ($85,611, a difference of 0.24%), and Scandinavian ($86,073, a difference of 0.30%).
| Demographics | Rating | Rank | Median Household Income |
| Luxembourgers | 70.0 /100 | #160 | Good $86,418 |
| Slavs | 69.7 /100 | #161 | Good $86,398 |
| Guamanians/Chamorros | 67.7 /100 | #162 | Good $86,255 |
| Czechs | 66.4 /100 | #163 | Good $86,164 |
| Irish | 66.2 /100 | #164 | Good $86,145 |
| Norwegians | 65.3 /100 | #165 | Good $86,084 |
| Scandinavians | 65.1 /100 | #166 | Good $86,073 |
| Immigrants | Immigrants | 61.3 /100 | #167 | Good $85,818 |
| Icelanders | 61.0 /100 | #168 | Good $85,797 |
| Colombians | 59.7 /100 | #169 | Average $85,716 |
| Swiss | 59.2 /100 | #170 | Average $85,681 |
| Immigrants | South America | 58.1 /100 | #171 | Average $85,611 |
| Slovenes | 57.4 /100 | #172 | Average $85,562 |
| Immigrants | Cameroon | 53.4 /100 | #173 | Average $85,314 |
| Scottish | 50.0 /100 | #174 | Average $85,101 |
Demographics Similar to Nicaraguans by Median Household Income
In terms of median household income, the demographic groups most similar to Nicaraguans are Barbadian ($79,664, a difference of 0.090%), Immigrants from Bosnia and Herzegovina ($79,888, a difference of 0.19%), Alaska Native ($79,509, a difference of 0.29%), Immigrants from Western Africa ($79,490, a difference of 0.31%), and Nonimmigrants ($79,429, a difference of 0.39%).
| Demographics | Rating | Rank | Median Household Income |
| Bermudans | 4.7 /100 | #230 | Tragic $80,406 |
| Trinidadians and Tobagonians | 4.7 /100 | #231 | Tragic $80,402 |
| Immigrants | Trinidad and Tobago | 4.6 /100 | #232 | Tragic $80,373 |
| Immigrants | Azores | 4.5 /100 | #233 | Tragic $80,357 |
| Immigrants | Ecuador | 4.5 /100 | #234 | Tragic $80,341 |
| Immigrants | Guyana | 4.5 /100 | #235 | Tragic $80,324 |
| Immigrants | Bosnia and Herzegovina | 3.4 /100 | #236 | Tragic $79,888 |
| Nicaraguans | 3.1 /100 | #237 | Tragic $79,737 |
| Barbadians | 3.0 /100 | #238 | Tragic $79,664 |
| Alaska Natives | 2.7 /100 | #239 | Tragic $79,509 |
| Immigrants | Western Africa | 2.7 /100 | #240 | Tragic $79,490 |
| Immigrants | Nonimmigrants | 2.6 /100 | #241 | Tragic $79,429 |
| Immigrants | Sudan | 2.1 /100 | #242 | Tragic $79,103 |
| Immigrants | Barbados | 1.9 /100 | #243 | Tragic $78,989 |
| Marshallese | 1.9 /100 | #244 | Tragic $78,930 |