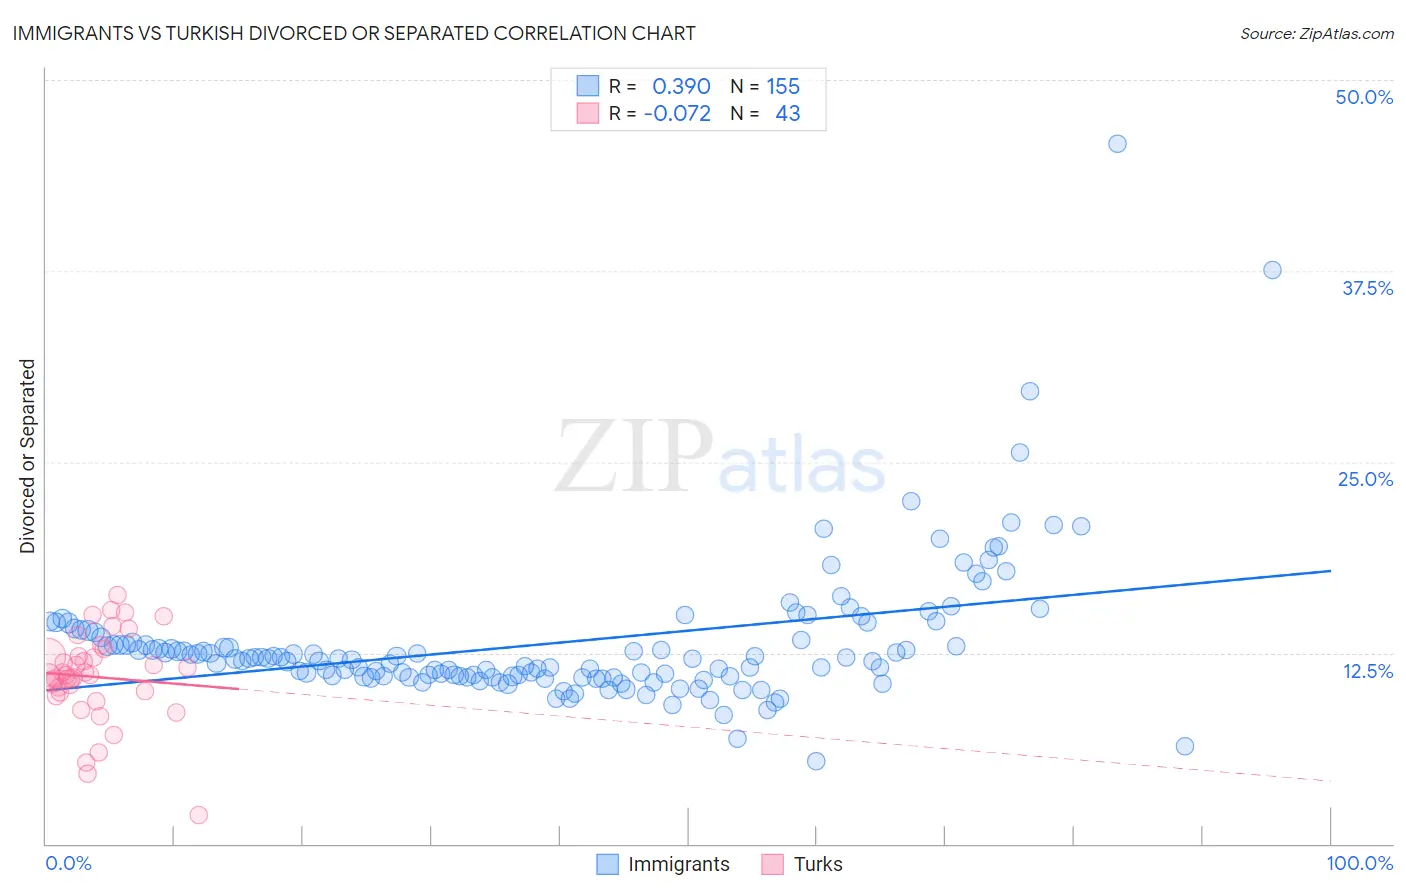
Immigrants vs Turkish Divorced or Separated
COMPARE
Immigrants
Turkish
Divorced or Separated
Divorced or Separated Comparison
Immigrants
Turks
11.8%
DIVORCED OR SEPARATED
93.7/ 100
METRIC RATING
123rd/ 347
METRIC RANK
11.2%
DIVORCED OR SEPARATED
100.0/ 100
METRIC RATING
45th/ 347
METRIC RANK
Immigrants vs Turkish Divorced or Separated Correlation Chart
The statistical analysis conducted on geographies consisting of 577,228,923 people shows a mild positive correlation between the proportion of Immigrants and percentage of population currently divorced or separated in the United States with a correlation coefficient (R) of 0.390 and weighted average of 11.8%. Similarly, the statistical analysis conducted on geographies consisting of 271,738,406 people shows a slight negative correlation between the proportion of Turks and percentage of population currently divorced or separated in the United States with a correlation coefficient (R) of -0.072 and weighted average of 11.2%, a difference of 5.2%.
Divorced or Separated Correlation Summary
| Measurement | Immigrants | Turkish |
| Minimum | 5.4% | 1.9% |
| Maximum | 45.8% | 16.3% |
| Range | 40.4% | 14.4% |
| Mean | 13.1% | 10.9% |
| Median | 12.1% | 11.0% |
| Interquartile 25% (IQ1) | 10.9% | 9.9% |
| Interquartile 75% (IQ3) | 13.5% | 12.3% |
| Interquartile Range (IQR) | 2.6% | 2.4% |
| Standard Deviation (Sample) | 4.7% | 2.9% |
| Standard Deviation (Population) | 4.7% | 2.9% |
Similar Demographics by Divorced or Separated
Demographics Similar to Immigrants by Divorced or Separated
In terms of divorced or separated, the demographic groups most similar to Immigrants are Menominee (11.8%, a difference of 0.020%), Ugandan (11.8%, a difference of 0.080%), Romanian (11.8%, a difference of 0.13%), Iraqi (11.8%, a difference of 0.15%), and Ukrainian (11.8%, a difference of 0.19%).
| Demographics | Rating | Rank | Divorced or Separated |
| Immigrants | Iraq | 95.4 /100 | #116 | Exceptional 11.7% |
| Immigrants | Uganda | 95.3 /100 | #117 | Exceptional 11.7% |
| Ecuadorians | 95.3 /100 | #118 | Exceptional 11.7% |
| Syrians | 95.1 /100 | #119 | Exceptional 11.7% |
| Iraqis | 94.6 /100 | #120 | Exceptional 11.8% |
| Romanians | 94.5 /100 | #121 | Exceptional 11.8% |
| Menominee | 93.8 /100 | #122 | Exceptional 11.8% |
| Immigrants | Immigrants | 93.7 /100 | #123 | Exceptional 11.8% |
| Ugandans | 93.1 /100 | #124 | Exceptional 11.8% |
| Ukrainians | 92.3 /100 | #125 | Exceptional 11.8% |
| South American Indians | 92.1 /100 | #126 | Exceptional 11.8% |
| South Africans | 88.9 /100 | #127 | Excellent 11.8% |
| Immigrants | Ecuador | 88.9 /100 | #128 | Excellent 11.8% |
| Immigrants | St. Vincent and the Grenadines | 88.4 /100 | #129 | Excellent 11.8% |
| Immigrants | Austria | 88.2 /100 | #130 | Excellent 11.8% |
Demographics Similar to Turks by Divorced or Separated
In terms of divorced or separated, the demographic groups most similar to Turks are Immigrants from Western Asia (11.2%, a difference of 0.050%), Immigrants from Belarus (11.2%, a difference of 0.060%), Chinese (11.2%, a difference of 0.070%), Laotian (11.2%, a difference of 0.11%), and Immigrants from Poland (11.2%, a difference of 0.12%).
| Demographics | Rating | Rank | Divorced or Separated |
| Immigrants | Greece | 100.0 /100 | #38 | Exceptional 11.1% |
| Immigrants | Egypt | 100.0 /100 | #39 | Exceptional 11.1% |
| Soviet Union | 100.0 /100 | #40 | Exceptional 11.1% |
| Bhutanese | 100.0 /100 | #41 | Exceptional 11.2% |
| Chinese | 100.0 /100 | #42 | Exceptional 11.2% |
| Immigrants | Belarus | 100.0 /100 | #43 | Exceptional 11.2% |
| Immigrants | Western Asia | 100.0 /100 | #44 | Exceptional 11.2% |
| Turks | 100.0 /100 | #45 | Exceptional 11.2% |
| Laotians | 100.0 /100 | #46 | Exceptional 11.2% |
| Immigrants | Poland | 100.0 /100 | #47 | Exceptional 11.2% |
| Immigrants | Turkey | 100.0 /100 | #48 | Exceptional 11.2% |
| Immigrants | Saudi Arabia | 100.0 /100 | #49 | Exceptional 11.2% |
| Bolivians | 100.0 /100 | #50 | Exceptional 11.2% |
| Immigrants | Bolivia | 100.0 /100 | #51 | Exceptional 11.3% |
| Immigrants | Australia | 99.9 /100 | #52 | Exceptional 11.3% |