Immigrants vs Pima Householder Income Ages 25 - 44 years
COMPARE
Immigrants
Pima
Householder Income Ages 25 - 44 years
Householder Income Ages 25 - 44 years Comparison
Immigrants
Pima
$94,423
HOUSEHOLDER INCOME AGES 25 - 44 YEARS
48.0/ 100
METRIC RATING
176th/ 347
METRIC RANK
$82,821
HOUSEHOLDER INCOME AGES 25 - 44 YEARS
0.1/ 100
METRIC RATING
279th/ 347
METRIC RANK
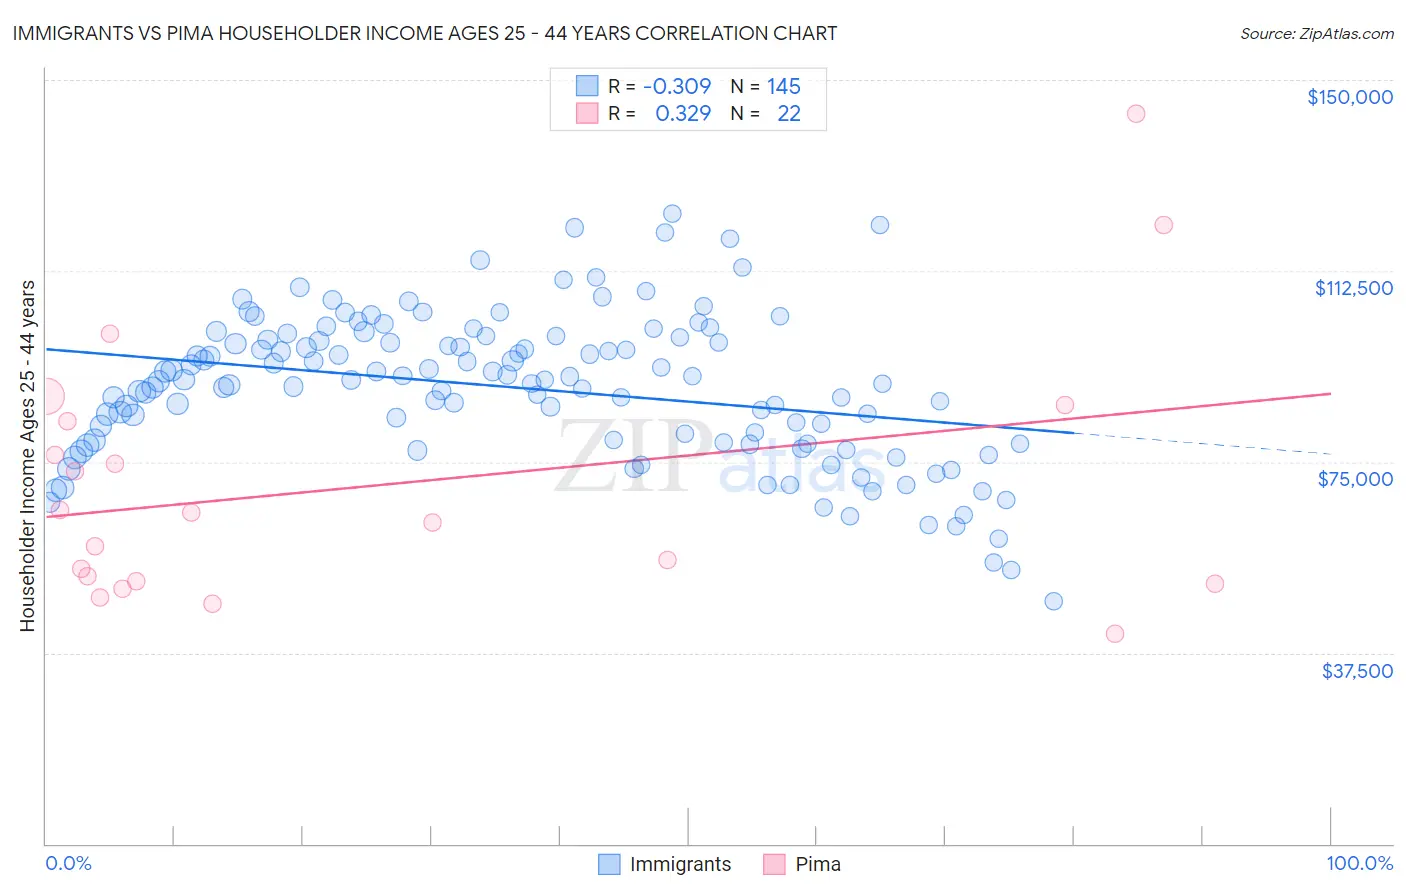
Immigrants vs Pima Householder Income Ages 25 - 44 years Correlation Chart
The statistical analysis conducted on geographies consisting of 570,849,729 people shows a mild negative correlation between the proportion of Immigrants and household income with householder between the ages 25 and 44 in the United States with a correlation coefficient (R) of -0.309 and weighted average of $94,423. Similarly, the statistical analysis conducted on geographies consisting of 61,441,839 people shows a mild positive correlation between the proportion of Pima and household income with householder between the ages 25 and 44 in the United States with a correlation coefficient (R) of 0.329 and weighted average of $82,821, a difference of 14.0%.
Householder Income Ages 25 - 44 years Correlation Summary
| Measurement | Immigrants | Pima |
| Minimum | $47,510 | $41,167 |
| Maximum | $123,721 | $143,258 |
| Range | $76,211 | $102,091 |
| Mean | $89,554 | $70,457 |
| Median | $91,017 | $64,038 |
| Interquartile 25% (IQ1) | $78,698 | $51,500 |
| Interquartile 75% (IQ3) | $99,239 | $82,898 |
| Interquartile Range (IQR) | $20,541 | $31,398 |
| Standard Deviation (Sample) | $14,494 | $25,507 |
| Standard Deviation (Population) | $14,444 | $24,921 |
Similar Demographics by Householder Income Ages 25 - 44 years
Demographics Similar to Immigrants by Householder Income Ages 25 - 44 years
In terms of householder income ages 25 - 44 years, the demographic groups most similar to Immigrants are English ($94,429, a difference of 0.010%), Colombian ($94,565, a difference of 0.15%), Belgian ($94,262, a difference of 0.17%), Finnish ($94,610, a difference of 0.20%), and Scottish ($94,622, a difference of 0.21%).
| Demographics | Rating | Rank | Householder Income Ages 25 - 44 years |
| Native Hawaiians | 56.8 /100 | #169 | Average $95,058 |
| Slovaks | 56.4 /100 | #170 | Average $95,032 |
| Immigrants | Armenia | 54.2 /100 | #171 | Average $94,867 |
| Scottish | 50.8 /100 | #172 | Average $94,622 |
| Finns | 50.6 /100 | #173 | Average $94,610 |
| Colombians | 50.0 /100 | #174 | Average $94,565 |
| English | 48.1 /100 | #175 | Average $94,429 |
| Immigrants | Immigrants | 48.0 /100 | #176 | Average $94,423 |
| Belgians | 45.8 /100 | #177 | Average $94,262 |
| Immigrants | South America | 42.8 /100 | #178 | Average $94,042 |
| French Canadians | 38.2 /100 | #179 | Fair $93,694 |
| French | 37.8 /100 | #180 | Fair $93,665 |
| Puget Sound Salish | 37.7 /100 | #181 | Fair $93,661 |
| Uruguayans | 37.3 /100 | #182 | Fair $93,631 |
| Guamanians/Chamorros | 36.5 /100 | #183 | Fair $93,569 |
Demographics Similar to Pima by Householder Income Ages 25 - 44 years
In terms of householder income ages 25 - 44 years, the demographic groups most similar to Pima are Senegalese ($82,852, a difference of 0.040%), Paiute ($82,984, a difference of 0.20%), Colville ($82,604, a difference of 0.26%), Immigrants from Belize ($83,141, a difference of 0.39%), and Cajun ($82,393, a difference of 0.52%).
| Demographics | Rating | Rank | Householder Income Ages 25 - 44 years |
| Spanish Americans | 0.2 /100 | #272 | Tragic $83,722 |
| Iroquois | 0.2 /100 | #273 | Tragic $83,682 |
| Marshallese | 0.2 /100 | #274 | Tragic $83,575 |
| Immigrants | Jamaica | 0.2 /100 | #275 | Tragic $83,298 |
| Immigrants | Belize | 0.2 /100 | #276 | Tragic $83,141 |
| Paiute | 0.2 /100 | #277 | Tragic $82,984 |
| Senegalese | 0.2 /100 | #278 | Tragic $82,852 |
| Pima | 0.1 /100 | #279 | Tragic $82,821 |
| Colville | 0.1 /100 | #280 | Tragic $82,604 |
| Cajuns | 0.1 /100 | #281 | Tragic $82,393 |
| Central American Indians | 0.1 /100 | #282 | Tragic $82,355 |
| Guatemalans | 0.1 /100 | #283 | Tragic $82,331 |
| Immigrants | Middle Africa | 0.1 /100 | #284 | Tragic $82,254 |
| Immigrants | Somalia | 0.1 /100 | #285 | Tragic $82,188 |
| Ute | 0.1 /100 | #286 | Tragic $82,166 |