Immigrants vs Irish Householder Income Ages 25 - 44 years
COMPARE
Immigrants
Irish
Householder Income Ages 25 - 44 years
Householder Income Ages 25 - 44 years Comparison
Immigrants
Irish
$94,423
HOUSEHOLDER INCOME AGES 25 - 44 YEARS
48.0/ 100
METRIC RATING
176th/ 347
METRIC RANK
$96,730
HOUSEHOLDER INCOME AGES 25 - 44 YEARS
76.9/ 100
METRIC RATING
148th/ 347
METRIC RANK
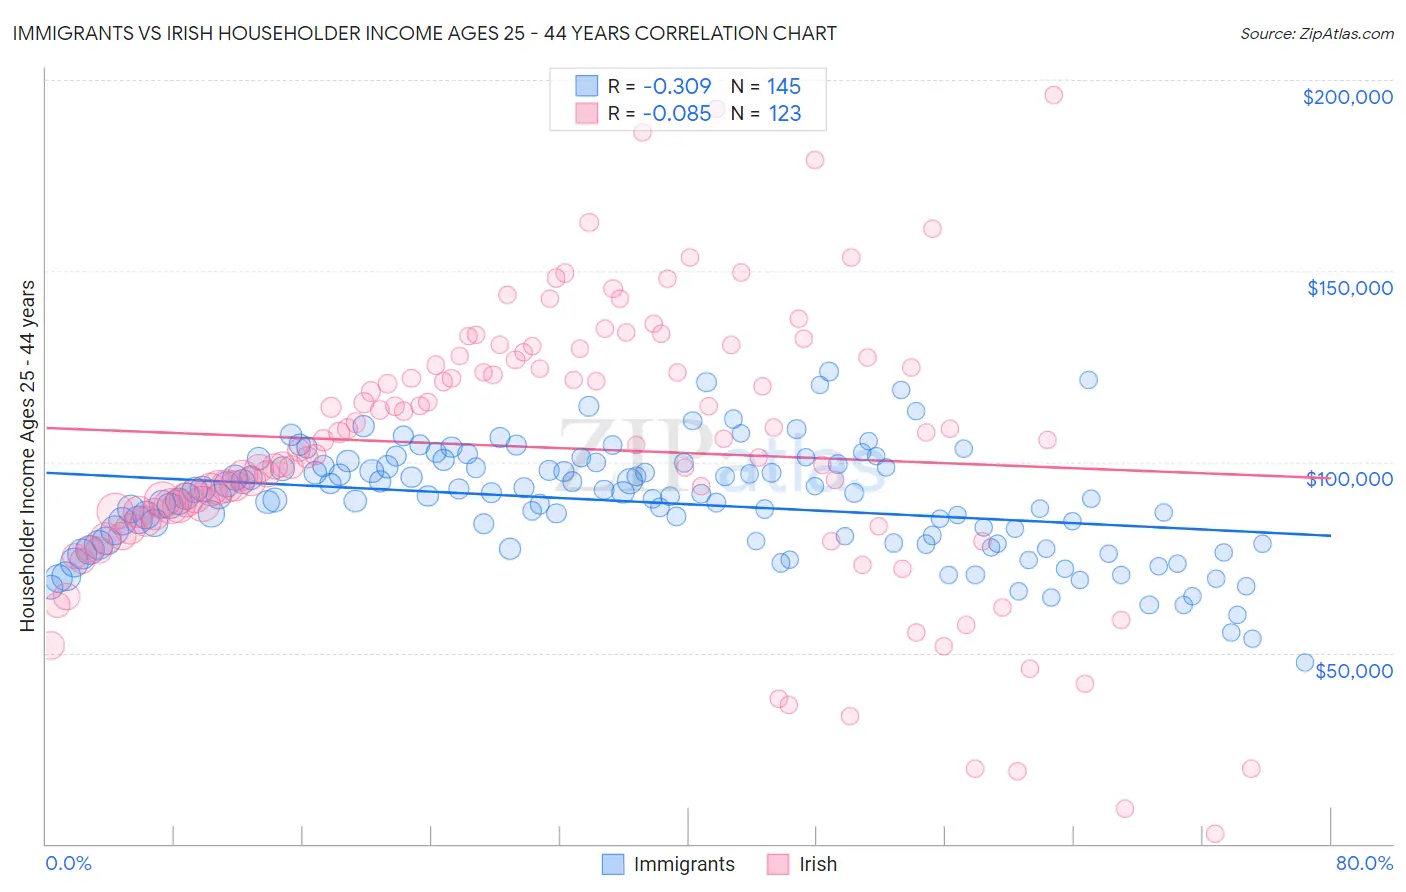
Immigrants vs Irish Householder Income Ages 25 - 44 years Correlation Chart
The statistical analysis conducted on geographies consisting of 570,849,729 people shows a mild negative correlation between the proportion of Immigrants and household income with householder between the ages 25 and 44 in the United States with a correlation coefficient (R) of -0.309 and weighted average of $94,423. Similarly, the statistical analysis conducted on geographies consisting of 572,831,094 people shows a slight negative correlation between the proportion of Irish and household income with householder between the ages 25 and 44 in the United States with a correlation coefficient (R) of -0.085 and weighted average of $96,730, a difference of 2.4%.
Householder Income Ages 25 - 44 years Correlation Summary
| Measurement | Immigrants | Irish |
| Minimum | $47,510 | $2,499 |
| Maximum | $123,721 | $195,924 |
| Range | $76,211 | $193,425 |
| Mean | $89,554 | $103,698 |
| Median | $91,017 | $105,634 |
| Interquartile 25% (IQ1) | $78,698 | $84,609 |
| Interquartile 75% (IQ3) | $99,239 | $127,232 |
| Interquartile Range (IQR) | $20,541 | $42,623 |
| Standard Deviation (Sample) | $14,494 | $36,620 |
| Standard Deviation (Population) | $14,444 | $36,470 |
Similar Demographics by Householder Income Ages 25 - 44 years
Demographics Similar to Immigrants by Householder Income Ages 25 - 44 years
In terms of householder income ages 25 - 44 years, the demographic groups most similar to Immigrants are English ($94,429, a difference of 0.010%), Colombian ($94,565, a difference of 0.15%), Belgian ($94,262, a difference of 0.17%), Finnish ($94,610, a difference of 0.20%), and Scottish ($94,622, a difference of 0.21%).
| Demographics | Rating | Rank | Householder Income Ages 25 - 44 years |
| Native Hawaiians | 56.8 /100 | #169 | Average $95,058 |
| Slovaks | 56.4 /100 | #170 | Average $95,032 |
| Immigrants | Armenia | 54.2 /100 | #171 | Average $94,867 |
| Scottish | 50.8 /100 | #172 | Average $94,622 |
| Finns | 50.6 /100 | #173 | Average $94,610 |
| Colombians | 50.0 /100 | #174 | Average $94,565 |
| English | 48.1 /100 | #175 | Average $94,429 |
| Immigrants | Immigrants | 48.0 /100 | #176 | Average $94,423 |
| Belgians | 45.8 /100 | #177 | Average $94,262 |
| Immigrants | South America | 42.8 /100 | #178 | Average $94,042 |
| French Canadians | 38.2 /100 | #179 | Fair $93,694 |
| French | 37.8 /100 | #180 | Fair $93,665 |
| Puget Sound Salish | 37.7 /100 | #181 | Fair $93,661 |
| Uruguayans | 37.3 /100 | #182 | Fair $93,631 |
| Guamanians/Chamorros | 36.5 /100 | #183 | Fair $93,569 |
Demographics Similar to Irish by Householder Income Ages 25 - 44 years
In terms of householder income ages 25 - 44 years, the demographic groups most similar to Irish are Basque ($96,709, a difference of 0.020%), Immigrants from Syria ($96,789, a difference of 0.060%), Ugandan ($96,667, a difference of 0.070%), Ethiopian ($96,824, a difference of 0.10%), and Norwegian ($96,866, a difference of 0.14%).
| Demographics | Rating | Rank | Householder Income Ages 25 - 44 years |
| Luxembourgers | 81.5 /100 | #141 | Excellent $97,237 |
| Danes | 81.3 /100 | #142 | Excellent $97,221 |
| Immigrants | Jordan | 81.0 /100 | #143 | Excellent $97,185 |
| Immigrants | Chile | 80.8 /100 | #144 | Excellent $97,159 |
| Norwegians | 78.2 /100 | #145 | Good $96,866 |
| Ethiopians | 77.8 /100 | #146 | Good $96,824 |
| Immigrants | Syria | 77.4 /100 | #147 | Good $96,789 |
| Irish | 76.9 /100 | #148 | Good $96,730 |
| Basques | 76.6 /100 | #149 | Good $96,709 |
| Ugandans | 76.2 /100 | #150 | Good $96,667 |
| Czechs | 74.8 /100 | #151 | Good $96,525 |
| South American Indians | 74.5 /100 | #152 | Good $96,497 |
| Slovenes | 73.9 /100 | #153 | Good $96,439 |
| Slavs | 73.2 /100 | #154 | Good $96,377 |
| Moroccans | 70.3 /100 | #155 | Good $96,117 |