Thai vs Immigrants from Sweden Median Earnings
COMPARE
Thai
Immigrants from Sweden
Median Earnings
Median Earnings Comparison
Thais
Immigrants from Sweden
$59,237
MEDIAN EARNINGS
100.0/ 100
METRIC RATING
5th/ 347
METRIC RANK
$54,478
MEDIAN EARNINGS
100.0/ 100
METRIC RATING
23rd/ 347
METRIC RANK
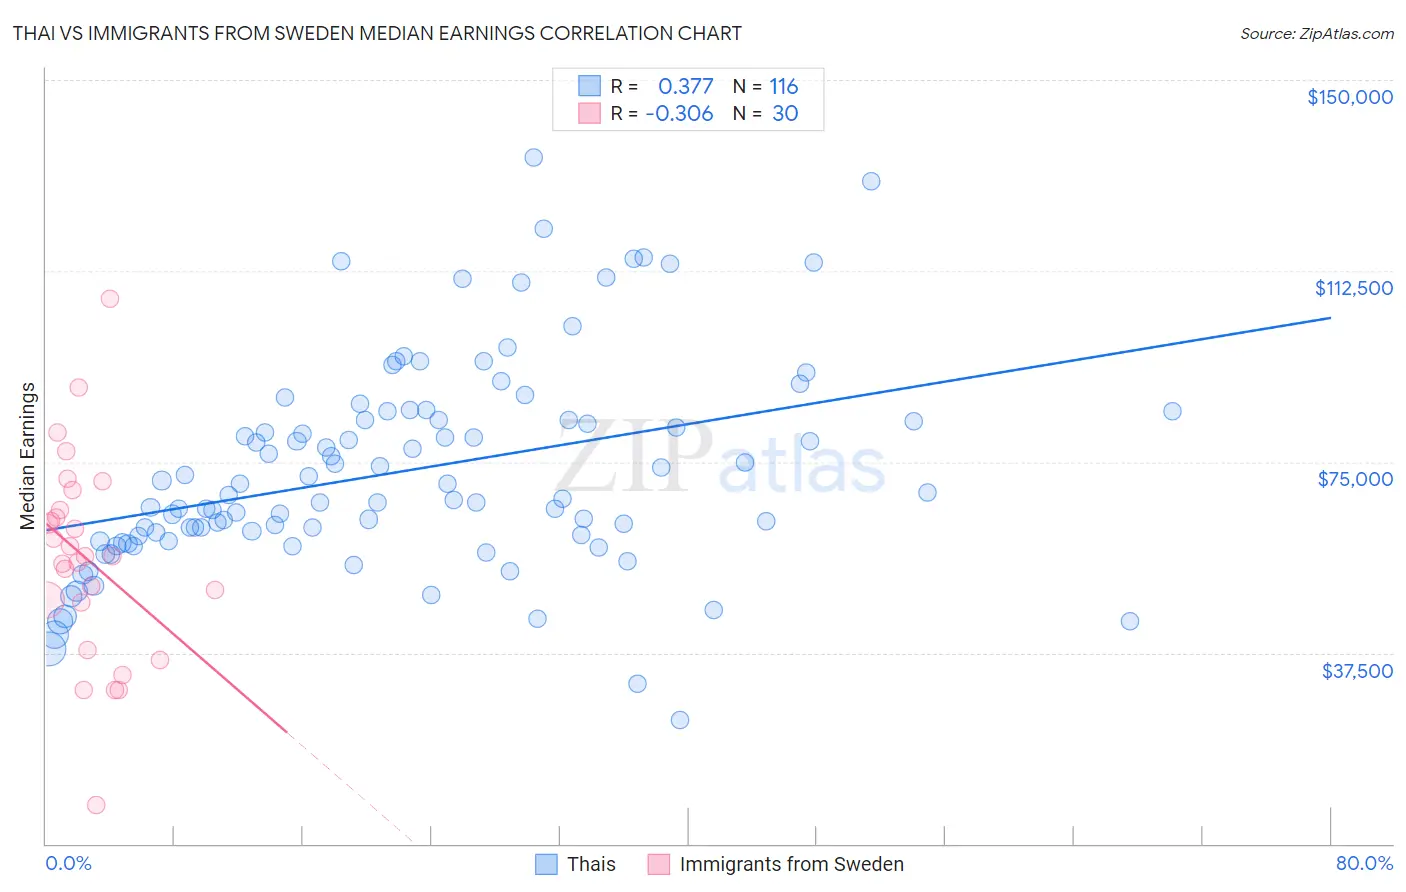
Thai vs Immigrants from Sweden Median Earnings Correlation Chart
The statistical analysis conducted on geographies consisting of 475,851,474 people shows a mild positive correlation between the proportion of Thais and median earnings in the United States with a correlation coefficient (R) of 0.377 and weighted average of $59,237. Similarly, the statistical analysis conducted on geographies consisting of 164,745,494 people shows a mild negative correlation between the proportion of Immigrants from Sweden and median earnings in the United States with a correlation coefficient (R) of -0.306 and weighted average of $54,478, a difference of 8.7%.
Median Earnings Correlation Summary
| Measurement | Thai | Immigrants from Sweden |
| Minimum | $24,353 | $7,643 |
| Maximum | $134,793 | $106,979 |
| Range | $110,440 | $99,336 |
| Mean | $73,089 | $56,044 |
| Median | $68,147 | $56,394 |
| Interquartile 25% (IQ1) | $59,963 | $47,341 |
| Interquartile 75% (IQ3) | $83,196 | $65,578 |
| Interquartile Range (IQR) | $23,232 | $18,237 |
| Standard Deviation (Sample) | $20,568 | $19,951 |
| Standard Deviation (Population) | $20,479 | $19,616 |
Demographics Similar to Thais and Immigrants from Sweden by Median Earnings
In terms of median earnings, the demographic groups most similar to Thais are Immigrants from Hong Kong ($59,433, a difference of 0.33%), Immigrants from Singapore ($59,038, a difference of 0.34%), Iranian ($58,474, a difference of 1.3%), Immigrants from Iran ($57,612, a difference of 2.8%), and Okinawan ($57,550, a difference of 2.9%). Similarly, the demographic groups most similar to Immigrants from Sweden are Immigrants from Korea ($54,530, a difference of 0.10%), Burmese ($54,559, a difference of 0.15%), Cypriot ($54,589, a difference of 0.20%), Soviet Union ($54,290, a difference of 0.35%), and Immigrants from Belgium ($54,679, a difference of 0.37%).
| Demographics | Rating | Rank | Median Earnings |
| Immigrants | Hong Kong | 100.0 /100 | #4 | Exceptional $59,433 |
| Thais | 100.0 /100 | #5 | Exceptional $59,237 |
| Immigrants | Singapore | 100.0 /100 | #6 | Exceptional $59,038 |
| Iranians | 100.0 /100 | #7 | Exceptional $58,474 |
| Immigrants | Iran | 100.0 /100 | #8 | Exceptional $57,612 |
| Okinawans | 100.0 /100 | #9 | Exceptional $57,550 |
| Immigrants | South Central Asia | 100.0 /100 | #10 | Exceptional $57,114 |
| Immigrants | Israel | 100.0 /100 | #11 | Exceptional $57,034 |
| Immigrants | Ireland | 100.0 /100 | #12 | Exceptional $56,854 |
| Immigrants | China | 100.0 /100 | #13 | Exceptional $56,638 |
| Immigrants | Australia | 100.0 /100 | #14 | Exceptional $56,305 |
| Indians (Asian) | 100.0 /100 | #15 | Exceptional $56,253 |
| Immigrants | Eastern Asia | 100.0 /100 | #16 | Exceptional $56,183 |
| Eastern Europeans | 100.0 /100 | #17 | Exceptional $55,084 |
| Immigrants | Japan | 100.0 /100 | #18 | Exceptional $54,938 |
| Immigrants | Belgium | 100.0 /100 | #19 | Exceptional $54,679 |
| Cypriots | 100.0 /100 | #20 | Exceptional $54,589 |
| Burmese | 100.0 /100 | #21 | Exceptional $54,559 |
| Immigrants | Korea | 100.0 /100 | #22 | Exceptional $54,530 |
| Immigrants | Sweden | 100.0 /100 | #23 | Exceptional $54,478 |
| Soviet Union | 100.0 /100 | #24 | Exceptional $54,290 |