Immigrants from Zaire vs Navajo Median Male Earnings
COMPARE
Immigrants from Zaire
Navajo
Median Male Earnings
Median Male Earnings Comparison
Immigrants from Zaire
Navajo
$47,070
MEDIAN MALE EARNINGS
0.1/ 100
METRIC RATING
299th/ 347
METRIC RANK
$42,098
MEDIAN MALE EARNINGS
0.0/ 100
METRIC RATING
340th/ 347
METRIC RANK
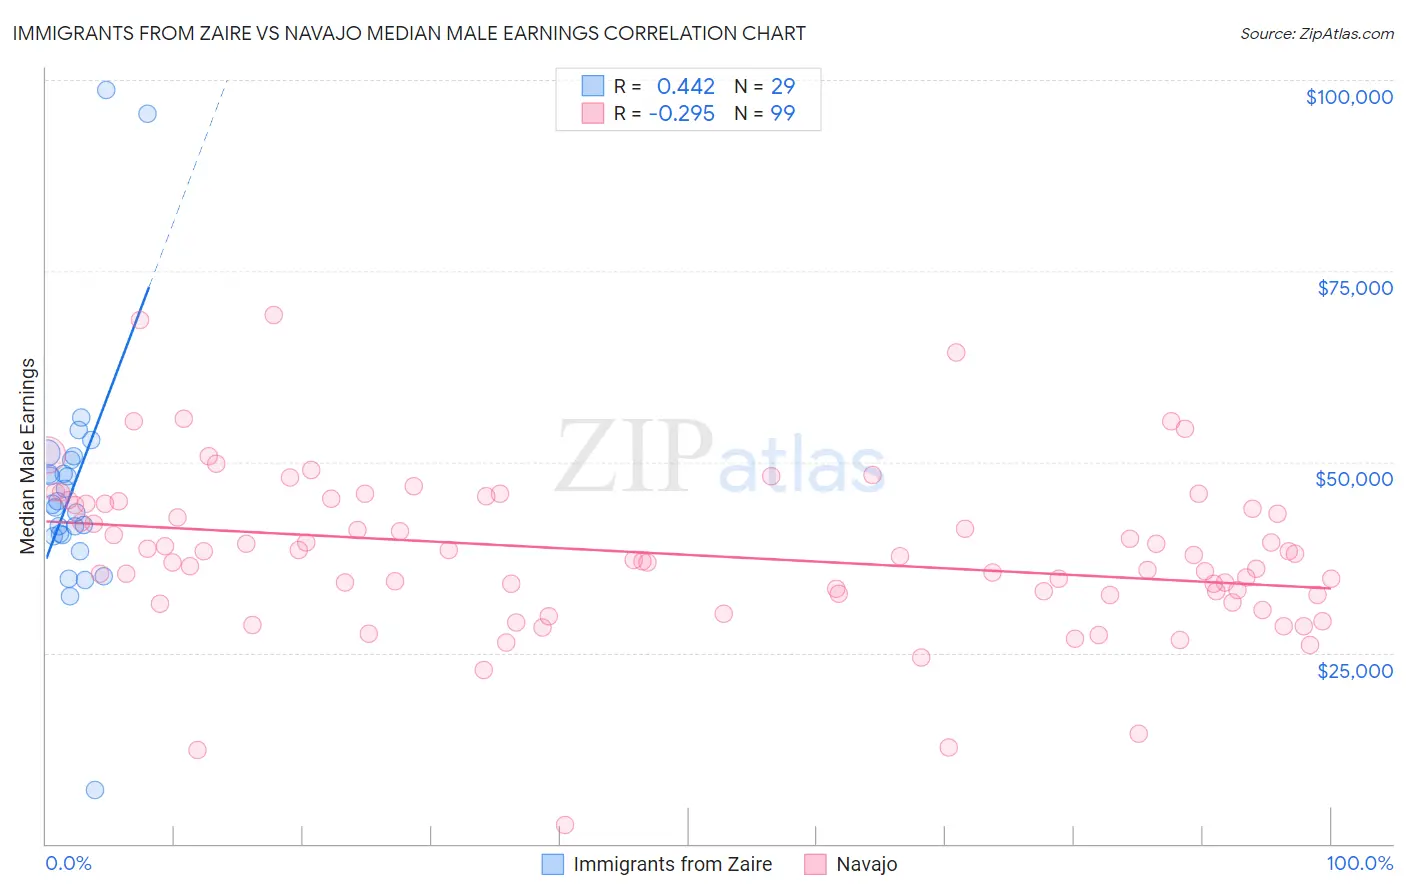
Immigrants from Zaire vs Navajo Median Male Earnings Correlation Chart
The statistical analysis conducted on geographies consisting of 107,252,506 people shows a moderate positive correlation between the proportion of Immigrants from Zaire and median male earnings in the United States with a correlation coefficient (R) of 0.442 and weighted average of $47,070. Similarly, the statistical analysis conducted on geographies consisting of 224,788,234 people shows a weak negative correlation between the proportion of Navajo and median male earnings in the United States with a correlation coefficient (R) of -0.295 and weighted average of $42,098, a difference of 11.8%.
Median Male Earnings Correlation Summary
| Measurement | Immigrants from Zaire | Navajo |
| Minimum | $7,065 | $2,499 |
| Maximum | $98,750 | $69,181 |
| Range | $91,685 | $66,682 |
| Mean | $46,699 | $37,941 |
| Median | $44,438 | $37,586 |
| Interquartile 25% (IQ1) | $40,386 | $32,558 |
| Interquartile 75% (IQ3) | $50,511 | $44,589 |
| Interquartile Range (IQR) | $10,125 | $12,031 |
| Standard Deviation (Sample) | $16,725 | $10,577 |
| Standard Deviation (Population) | $16,434 | $10,524 |
Similar Demographics by Median Male Earnings
Demographics Similar to Immigrants from Zaire by Median Male Earnings
In terms of median male earnings, the demographic groups most similar to Immigrants from Zaire are U.S. Virgin Islander ($47,066, a difference of 0.010%), Immigrants from Micronesia ($47,177, a difference of 0.23%), Dominican ($47,204, a difference of 0.28%), Immigrants from Latin America ($46,941, a difference of 0.28%), and Inupiat ($47,281, a difference of 0.45%).
| Demographics | Rating | Rank | Median Male Earnings |
| Immigrants | Dominica | 0.1 /100 | #292 | Tragic $47,651 |
| Indonesians | 0.1 /100 | #293 | Tragic $47,503 |
| Immigrants | Nicaragua | 0.1 /100 | #294 | Tragic $47,482 |
| Central American Indians | 0.1 /100 | #295 | Tragic $47,433 |
| Inupiat | 0.1 /100 | #296 | Tragic $47,281 |
| Dominicans | 0.1 /100 | #297 | Tragic $47,204 |
| Immigrants | Micronesia | 0.1 /100 | #298 | Tragic $47,177 |
| Immigrants | Zaire | 0.1 /100 | #299 | Tragic $47,070 |
| U.S. Virgin Islanders | 0.1 /100 | #300 | Tragic $47,066 |
| Immigrants | Latin America | 0.1 /100 | #301 | Tragic $46,941 |
| Seminole | 0.1 /100 | #302 | Tragic $46,783 |
| Yaqui | 0.1 /100 | #303 | Tragic $46,777 |
| Bangladeshis | 0.1 /100 | #304 | Tragic $46,744 |
| Guatemalans | 0.0 /100 | #305 | Tragic $46,736 |
| Dutch West Indians | 0.0 /100 | #306 | Tragic $46,656 |
Demographics Similar to Navajo by Median Male Earnings
In terms of median male earnings, the demographic groups most similar to Navajo are Hopi ($42,060, a difference of 0.090%), Pima ($42,357, a difference of 0.62%), Crow ($42,434, a difference of 0.80%), Arapaho ($41,758, a difference of 0.81%), and Lumbee ($41,715, a difference of 0.92%).
| Demographics | Rating | Rank | Median Male Earnings |
| Immigrants | Congo | 0.0 /100 | #333 | Tragic $44,204 |
| Immigrants | Yemen | 0.0 /100 | #334 | Tragic $44,083 |
| Spanish American Indians | 0.0 /100 | #335 | Tragic $44,010 |
| Immigrants | Cuba | 0.0 /100 | #336 | Tragic $43,461 |
| Menominee | 0.0 /100 | #337 | Tragic $42,581 |
| Crow | 0.0 /100 | #338 | Tragic $42,434 |
| Pima | 0.0 /100 | #339 | Tragic $42,357 |
| Navajo | 0.0 /100 | #340 | Tragic $42,098 |
| Hopi | 0.0 /100 | #341 | Tragic $42,060 |
| Arapaho | 0.0 /100 | #342 | Tragic $41,758 |
| Lumbee | 0.0 /100 | #343 | Tragic $41,715 |
| Pueblo | 0.0 /100 | #344 | Tragic $41,314 |
| Puerto Ricans | 0.0 /100 | #345 | Tragic $40,071 |
| Tohono O'odham | 0.0 /100 | #346 | Tragic $39,543 |
| Yup'ik | 0.0 /100 | #347 | Tragic $39,504 |