Immigrants from Zaire vs Sri Lankan Male Poverty
COMPARE
Immigrants from Zaire
Sri Lankan
Male Poverty
Male Poverty Comparison
Immigrants from Zaire
Sri Lankans
13.8%
MALE POVERTY
0.0/ 100
METRIC RATING
290th/ 347
METRIC RANK
10.6%
MALE POVERTY
88.1/ 100
METRIC RATING
116th/ 347
METRIC RANK
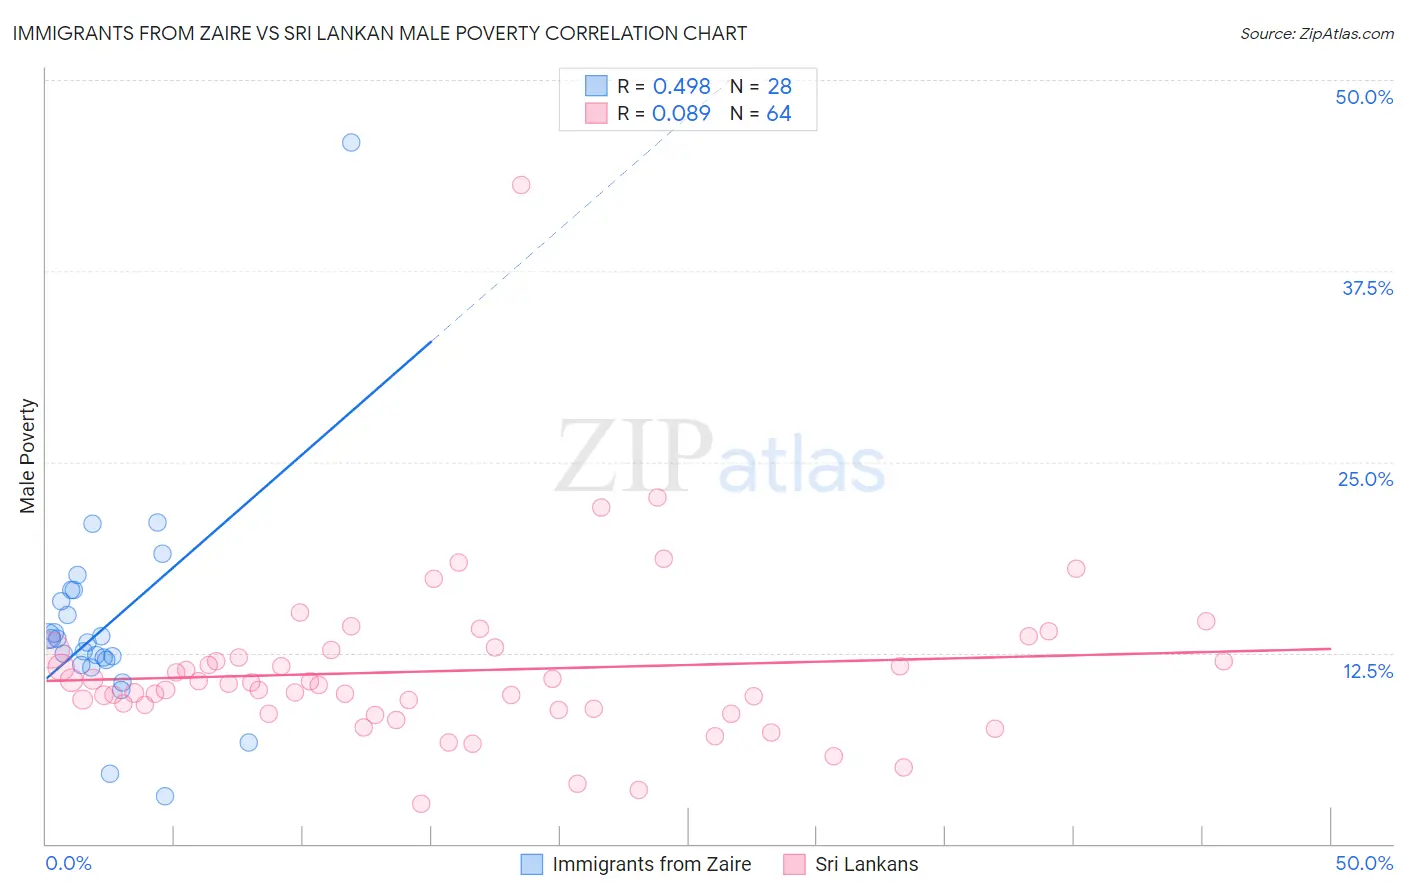
Immigrants from Zaire vs Sri Lankan Male Poverty Correlation Chart
The statistical analysis conducted on geographies consisting of 107,236,252 people shows a moderate positive correlation between the proportion of Immigrants from Zaire and poverty level among males in the United States with a correlation coefficient (R) of 0.498 and weighted average of 13.8%. Similarly, the statistical analysis conducted on geographies consisting of 439,980,227 people shows a slight positive correlation between the proportion of Sri Lankans and poverty level among males in the United States with a correlation coefficient (R) of 0.089 and weighted average of 10.6%, a difference of 29.8%.
Male Poverty Correlation Summary
| Measurement | Immigrants from Zaire | Sri Lankan |
| Minimum | 3.1% | 2.6% |
| Maximum | 45.9% | 43.1% |
| Range | 42.8% | 40.5% |
| Mean | 14.3% | 11.3% |
| Median | 13.3% | 10.4% |
| Interquartile 25% (IQ1) | 11.9% | 8.8% |
| Interquartile 75% (IQ3) | 16.3% | 12.4% |
| Interquartile Range (IQR) | 4.4% | 3.6% |
| Standard Deviation (Sample) | 7.4% | 5.6% |
| Standard Deviation (Population) | 7.3% | 5.5% |
Similar Demographics by Male Poverty
Demographics Similar to Immigrants from Zaire by Male Poverty
In terms of male poverty, the demographic groups most similar to Immigrants from Zaire are Guatemalan (13.8%, a difference of 0.010%), Vietnamese (13.8%, a difference of 0.090%), Immigrants from St. Vincent and the Grenadines (13.8%, a difference of 0.18%), Indonesian (13.8%, a difference of 0.26%), and Immigrants from Belize (13.8%, a difference of 0.27%).
| Demographics | Rating | Rank | Male Poverty |
| Comanche | 0.0 /100 | #283 | Tragic 13.8% |
| Immigrants | Haiti | 0.0 /100 | #284 | Tragic 13.8% |
| West Indians | 0.0 /100 | #285 | Tragic 13.8% |
| Shoshone | 0.0 /100 | #286 | Tragic 13.8% |
| Immigrants | Barbados | 0.0 /100 | #287 | Tragic 13.8% |
| Immigrants | St. Vincent and the Grenadines | 0.0 /100 | #288 | Tragic 13.8% |
| Guatemalans | 0.0 /100 | #289 | Tragic 13.8% |
| Immigrants | Zaire | 0.0 /100 | #290 | Tragic 13.8% |
| Vietnamese | 0.0 /100 | #291 | Tragic 13.8% |
| Indonesians | 0.0 /100 | #292 | Tragic 13.8% |
| Immigrants | Belize | 0.0 /100 | #293 | Tragic 13.8% |
| Hispanics or Latinos | 0.0 /100 | #294 | Tragic 13.9% |
| Immigrants | Central America | 0.0 /100 | #295 | Tragic 13.9% |
| Cajuns | 0.0 /100 | #296 | Tragic 13.9% |
| Inupiat | 0.0 /100 | #297 | Tragic 14.0% |
Demographics Similar to Sri Lankans by Male Poverty
In terms of male poverty, the demographic groups most similar to Sri Lankans are Immigrants from South Eastern Asia (10.6%, a difference of 0.010%), Immigrants from Russia (10.6%, a difference of 0.11%), Okinawan (10.7%, a difference of 0.12%), Immigrants from Hungary (10.7%, a difference of 0.13%), and Immigrants from Brazil (10.6%, a difference of 0.23%).
| Demographics | Rating | Rank | Male Poverty |
| Albanians | 90.6 /100 | #109 | Exceptional 10.6% |
| Argentineans | 90.1 /100 | #110 | Exceptional 10.6% |
| Immigrants | Argentina | 89.8 /100 | #111 | Excellent 10.6% |
| Immigrants | Turkey | 89.5 /100 | #112 | Excellent 10.6% |
| Palestinians | 89.1 /100 | #113 | Excellent 10.6% |
| Immigrants | Brazil | 89.0 /100 | #114 | Excellent 10.6% |
| Immigrants | Russia | 88.6 /100 | #115 | Excellent 10.6% |
| Sri Lankans | 88.1 /100 | #116 | Excellent 10.6% |
| Immigrants | South Eastern Asia | 88.1 /100 | #117 | Excellent 10.6% |
| Okinawans | 87.6 /100 | #118 | Excellent 10.7% |
| Immigrants | Hungary | 87.6 /100 | #119 | Excellent 10.7% |
| Immigrants | China | 87.1 /100 | #120 | Excellent 10.7% |
| Peruvians | 87.1 /100 | #121 | Excellent 10.7% |
| Native Hawaiians | 87.0 /100 | #122 | Excellent 10.7% |
| South Africans | 86.8 /100 | #123 | Excellent 10.7% |