Immigrants from Zaire vs Jordanian Householder Income Ages 25 - 44 years
COMPARE
Immigrants from Zaire
Jordanian
Householder Income Ages 25 - 44 years
Householder Income Ages 25 - 44 years Comparison
Immigrants from Zaire
Jordanians
$78,045
HOUSEHOLDER INCOME AGES 25 - 44 YEARS
0.0/ 100
METRIC RATING
321st/ 347
METRIC RANK
$99,186
HOUSEHOLDER INCOME AGES 25 - 44 YEARS
92.8/ 100
METRIC RATING
119th/ 347
METRIC RANK
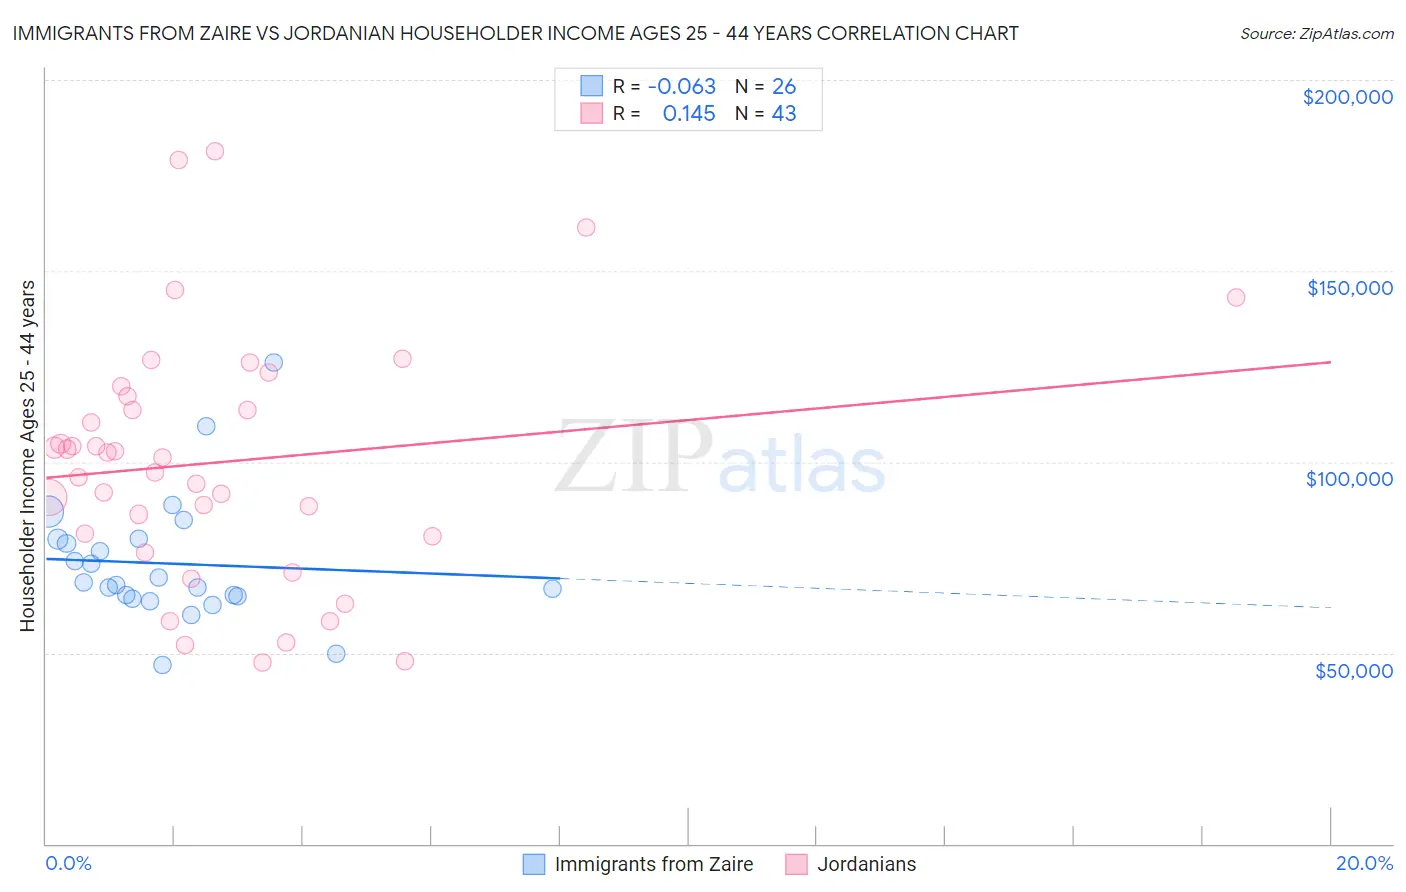
Immigrants from Zaire vs Jordanian Householder Income Ages 25 - 44 years Correlation Chart
The statistical analysis conducted on geographies consisting of 107,186,702 people shows a slight negative correlation between the proportion of Immigrants from Zaire and household income with householder between the ages 25 and 44 in the United States with a correlation coefficient (R) of -0.063 and weighted average of $78,045. Similarly, the statistical analysis conducted on geographies consisting of 166,327,979 people shows a poor positive correlation between the proportion of Jordanians and household income with householder between the ages 25 and 44 in the United States with a correlation coefficient (R) of 0.145 and weighted average of $99,186, a difference of 27.1%.
Householder Income Ages 25 - 44 years Correlation Summary
| Measurement | Immigrants from Zaire | Jordanian |
| Minimum | $46,875 | $47,305 |
| Maximum | $125,889 | $181,494 |
| Range | $79,014 | $134,189 |
| Mean | $73,350 | $99,931 |
| Median | $68,084 | $101,206 |
| Interquartile 25% (IQ1) | $64,948 | $80,556 |
| Interquartile 75% (IQ3) | $79,800 | $117,253 |
| Interquartile Range (IQR) | $14,852 | $36,697 |
| Standard Deviation (Sample) | $16,583 | $32,051 |
| Standard Deviation (Population) | $16,261 | $31,676 |
Similar Demographics by Householder Income Ages 25 - 44 years
Demographics Similar to Immigrants from Zaire by Householder Income Ages 25 - 44 years
In terms of householder income ages 25 - 44 years, the demographic groups most similar to Immigrants from Zaire are Chickasaw ($77,929, a difference of 0.15%), Choctaw ($78,168, a difference of 0.16%), Honduran ($78,540, a difference of 0.63%), Immigrants from Honduras ($77,328, a difference of 0.93%), and Immigrants from Mexico ($78,809, a difference of 0.98%).
| Demographics | Rating | Rank | Householder Income Ages 25 - 44 years |
| Cheyenne | 0.0 /100 | #314 | Tragic $79,152 |
| Ottawa | 0.0 /100 | #315 | Tragic $79,012 |
| Africans | 0.0 /100 | #316 | Tragic $78,986 |
| U.S. Virgin Islanders | 0.0 /100 | #317 | Tragic $78,911 |
| Immigrants | Mexico | 0.0 /100 | #318 | Tragic $78,809 |
| Hondurans | 0.0 /100 | #319 | Tragic $78,540 |
| Choctaw | 0.0 /100 | #320 | Tragic $78,168 |
| Immigrants | Zaire | 0.0 /100 | #321 | Tragic $78,045 |
| Chickasaw | 0.0 /100 | #322 | Tragic $77,929 |
| Immigrants | Honduras | 0.0 /100 | #323 | Tragic $77,328 |
| Dutch West Indians | 0.0 /100 | #324 | Tragic $77,260 |
| Sioux | 0.0 /100 | #325 | Tragic $77,089 |
| Houma | 0.0 /100 | #326 | Tragic $77,044 |
| Immigrants | Bahamas | 0.0 /100 | #327 | Tragic $76,910 |
| Immigrants | Cuba | 0.0 /100 | #328 | Tragic $76,701 |
Demographics Similar to Jordanians by Householder Income Ages 25 - 44 years
In terms of householder income ages 25 - 44 years, the demographic groups most similar to Jordanians are Syrian ($99,215, a difference of 0.030%), Immigrants from Northern Africa ($99,232, a difference of 0.050%), Swedish ($99,136, a difference of 0.050%), Portuguese ($99,429, a difference of 0.24%), and Carpatho Rusyn ($99,449, a difference of 0.27%).
| Demographics | Rating | Rank | Householder Income Ages 25 - 44 years |
| Poles | 94.5 /100 | #112 | Exceptional $99,685 |
| Tongans | 94.2 /100 | #113 | Exceptional $99,604 |
| Immigrants | Western Asia | 94.0 /100 | #114 | Exceptional $99,516 |
| Carpatho Rusyns | 93.7 /100 | #115 | Exceptional $99,449 |
| Portuguese | 93.7 /100 | #116 | Exceptional $99,429 |
| Immigrants | Northern Africa | 93.0 /100 | #117 | Exceptional $99,232 |
| Syrians | 92.9 /100 | #118 | Exceptional $99,215 |
| Jordanians | 92.8 /100 | #119 | Exceptional $99,186 |
| Swedes | 92.7 /100 | #120 | Exceptional $99,136 |
| Peruvians | 91.7 /100 | #121 | Exceptional $98,886 |
| Immigrants | Uzbekistan | 91.5 /100 | #122 | Exceptional $98,849 |
| Palestinians | 91.2 /100 | #123 | Exceptional $98,777 |
| Zimbabweans | 90.3 /100 | #124 | Exceptional $98,586 |
| Pakistanis | 89.3 /100 | #125 | Excellent $98,401 |
| British | 89.1 /100 | #126 | Excellent $98,359 |