Eastern European vs Mexican American Indian Median Earnings
COMPARE
Eastern European
Mexican American Indian
Median Earnings
Median Earnings Comparison
Eastern Europeans
Mexican American Indians
$55,084
MEDIAN EARNINGS
100.0/ 100
METRIC RATING
17th/ 347
METRIC RANK
$41,719
MEDIAN EARNINGS
0.1/ 100
METRIC RATING
286th/ 347
METRIC RANK
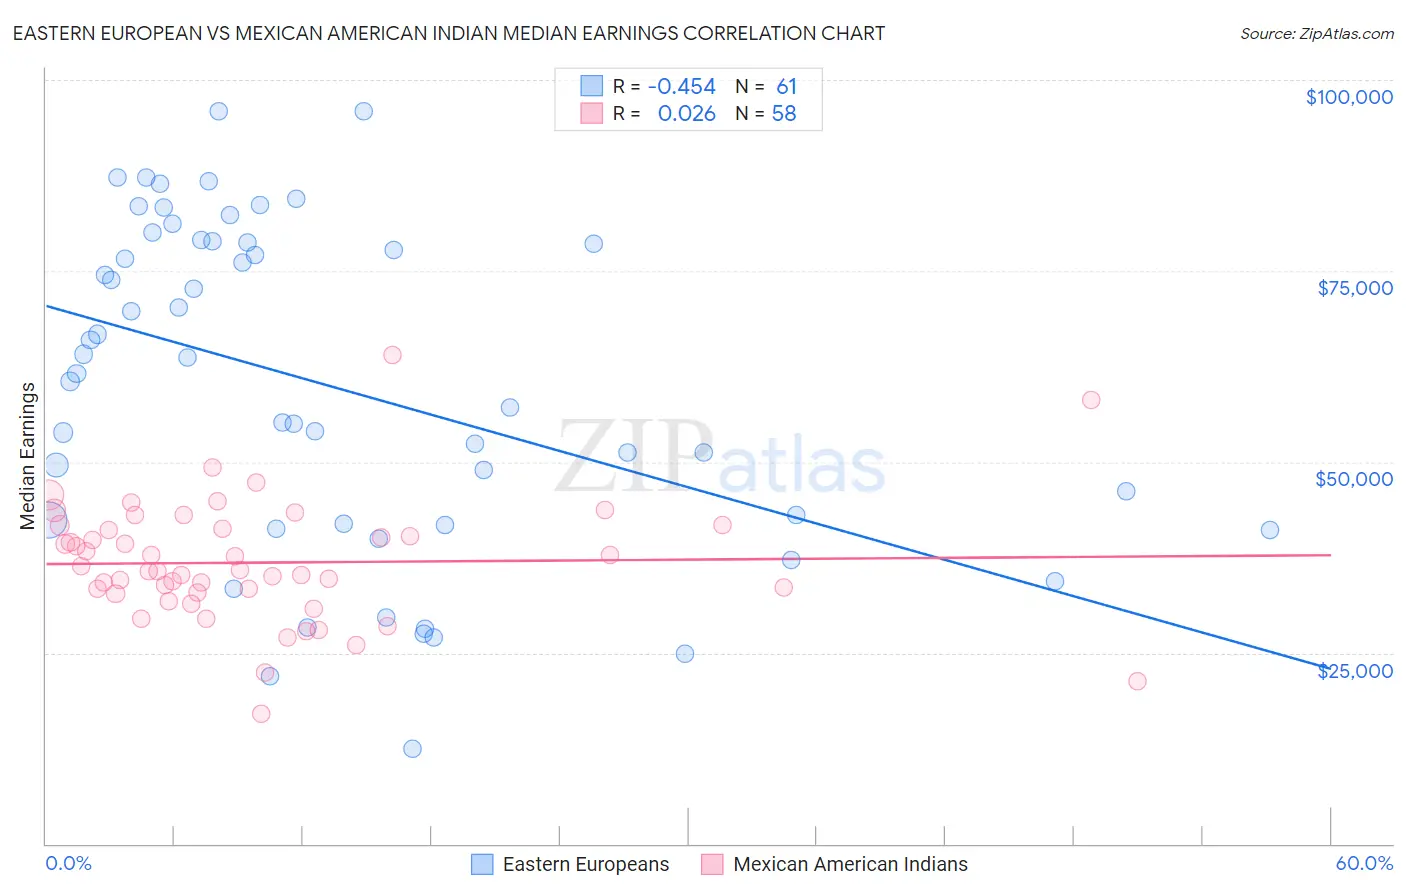
Eastern European vs Mexican American Indian Median Earnings Correlation Chart
The statistical analysis conducted on geographies consisting of 461,197,031 people shows a moderate negative correlation between the proportion of Eastern Europeans and median earnings in the United States with a correlation coefficient (R) of -0.454 and weighted average of $55,084. Similarly, the statistical analysis conducted on geographies consisting of 317,581,604 people shows no correlation between the proportion of Mexican American Indians and median earnings in the United States with a correlation coefficient (R) of 0.026 and weighted average of $41,719, a difference of 32.0%.
Median Earnings Correlation Summary
| Measurement | Eastern European | Mexican American Indian |
| Minimum | $12,500 | $16,986 |
| Maximum | $95,935 | $63,917 |
| Range | $83,435 | $46,931 |
| Mean | $59,916 | $36,825 |
| Median | $61,581 | $35,754 |
| Interquartile 25% (IQ1) | $41,817 | $32,817 |
| Interquartile 75% (IQ3) | $78,787 | $41,197 |
| Interquartile Range (IQR) | $36,970 | $8,379 |
| Standard Deviation (Sample) | $21,428 | $7,970 |
| Standard Deviation (Population) | $21,251 | $7,901 |
Similar Demographics by Median Earnings
Demographics Similar to Eastern Europeans by Median Earnings
In terms of median earnings, the demographic groups most similar to Eastern Europeans are Immigrants from Japan ($54,938, a difference of 0.26%), Immigrants from Belgium ($54,679, a difference of 0.74%), Cypriot ($54,589, a difference of 0.91%), Burmese ($54,559, a difference of 0.96%), and Immigrants from Korea ($54,530, a difference of 1.0%).
| Demographics | Rating | Rank | Median Earnings |
| Immigrants | South Central Asia | 100.0 /100 | #10 | Exceptional $57,114 |
| Immigrants | Israel | 100.0 /100 | #11 | Exceptional $57,034 |
| Immigrants | Ireland | 100.0 /100 | #12 | Exceptional $56,854 |
| Immigrants | China | 100.0 /100 | #13 | Exceptional $56,638 |
| Immigrants | Australia | 100.0 /100 | #14 | Exceptional $56,305 |
| Indians (Asian) | 100.0 /100 | #15 | Exceptional $56,253 |
| Immigrants | Eastern Asia | 100.0 /100 | #16 | Exceptional $56,183 |
| Eastern Europeans | 100.0 /100 | #17 | Exceptional $55,084 |
| Immigrants | Japan | 100.0 /100 | #18 | Exceptional $54,938 |
| Immigrants | Belgium | 100.0 /100 | #19 | Exceptional $54,679 |
| Cypriots | 100.0 /100 | #20 | Exceptional $54,589 |
| Burmese | 100.0 /100 | #21 | Exceptional $54,559 |
| Immigrants | Korea | 100.0 /100 | #22 | Exceptional $54,530 |
| Immigrants | Sweden | 100.0 /100 | #23 | Exceptional $54,478 |
| Soviet Union | 100.0 /100 | #24 | Exceptional $54,290 |
Demographics Similar to Mexican American Indians by Median Earnings
In terms of median earnings, the demographic groups most similar to Mexican American Indians are Immigrants from Nicaragua ($41,737, a difference of 0.040%), Indonesian ($41,701, a difference of 0.040%), Blackfeet ($41,822, a difference of 0.25%), Dominican ($41,864, a difference of 0.35%), and Immigrants from Dominican Republic ($41,554, a difference of 0.40%).
| Demographics | Rating | Rank | Median Earnings |
| Colville | 0.2 /100 | #279 | Tragic $42,151 |
| Hmong | 0.2 /100 | #280 | Tragic $42,111 |
| Marshallese | 0.2 /100 | #281 | Tragic $41,969 |
| Africans | 0.2 /100 | #282 | Tragic $41,955 |
| Dominicans | 0.2 /100 | #283 | Tragic $41,864 |
| Blackfeet | 0.2 /100 | #284 | Tragic $41,822 |
| Immigrants | Nicaragua | 0.1 /100 | #285 | Tragic $41,737 |
| Mexican American Indians | 0.1 /100 | #286 | Tragic $41,719 |
| Indonesians | 0.1 /100 | #287 | Tragic $41,701 |
| Immigrants | Dominican Republic | 0.1 /100 | #288 | Tragic $41,554 |
| Comanche | 0.1 /100 | #289 | Tragic $41,519 |
| Paiute | 0.1 /100 | #290 | Tragic $41,508 |
| Central American Indians | 0.1 /100 | #291 | Tragic $41,474 |
| U.S. Virgin Islanders | 0.1 /100 | #292 | Tragic $41,448 |
| Immigrants | Zaire | 0.1 /100 | #293 | Tragic $41,325 |