English vs Mexican American Indian Median Earnings
COMPARE
English
Mexican American Indian
Median Earnings
Median Earnings Comparison
English
Mexican American Indians
$46,334
MEDIAN EARNINGS
46.5/ 100
METRIC RATING
179th/ 347
METRIC RANK
$41,719
MEDIAN EARNINGS
0.1/ 100
METRIC RATING
286th/ 347
METRIC RANK
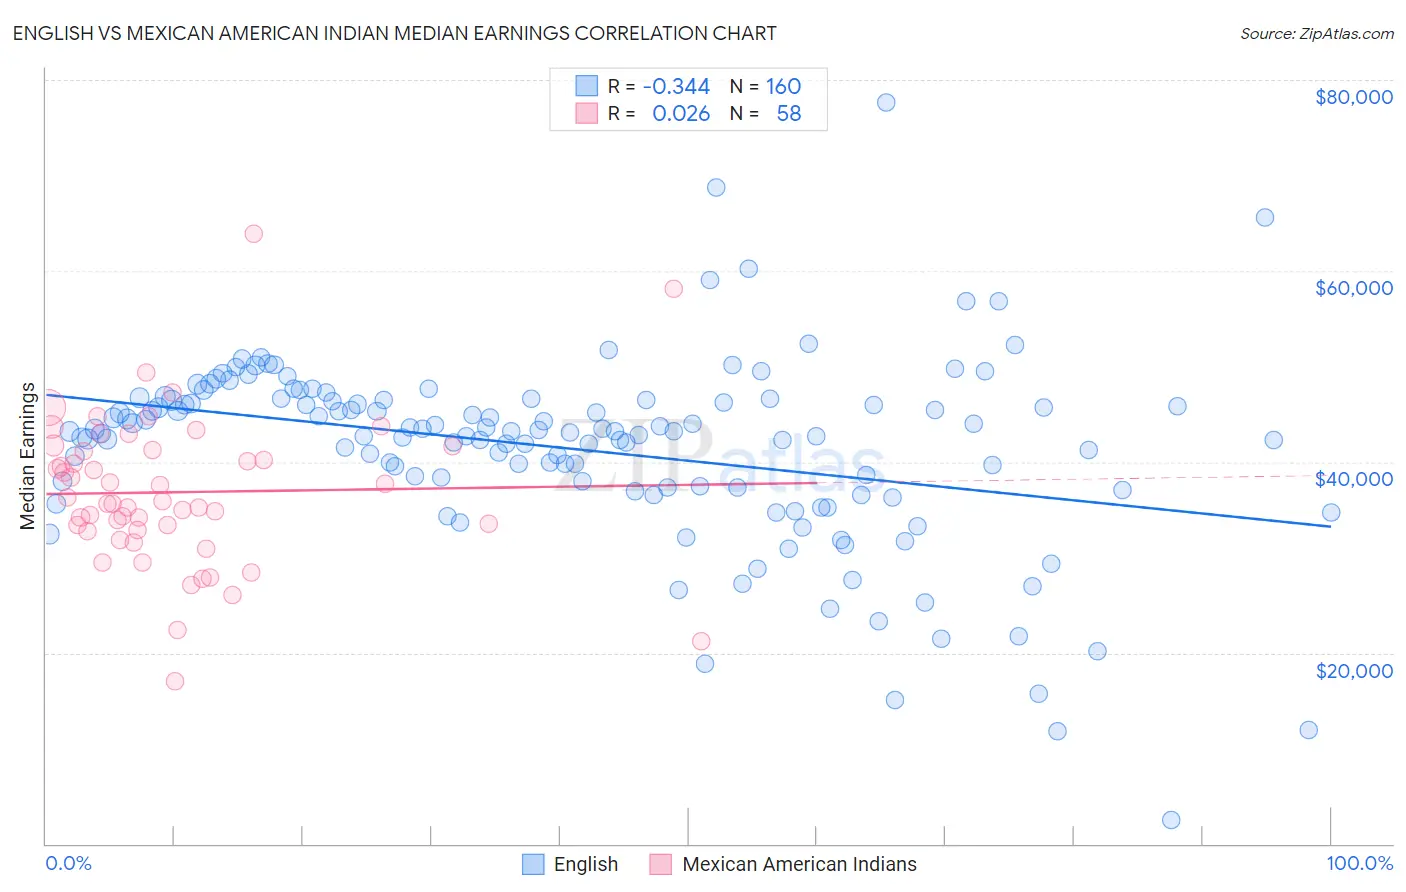
English vs Mexican American Indian Median Earnings Correlation Chart
The statistical analysis conducted on geographies consisting of 579,205,979 people shows a mild negative correlation between the proportion of English and median earnings in the United States with a correlation coefficient (R) of -0.344 and weighted average of $46,334. Similarly, the statistical analysis conducted on geographies consisting of 317,581,604 people shows no correlation between the proportion of Mexican American Indians and median earnings in the United States with a correlation coefficient (R) of 0.026 and weighted average of $41,719, a difference of 11.1%.
Median Earnings Correlation Summary
| Measurement | English | Mexican American Indian |
| Minimum | $2,499 | $16,986 |
| Maximum | $77,673 | $63,917 |
| Range | $75,174 | $46,931 |
| Mean | $41,372 | $36,825 |
| Median | $43,164 | $35,754 |
| Interquartile 25% (IQ1) | $37,358 | $32,817 |
| Interquartile 75% (IQ3) | $46,458 | $41,197 |
| Interquartile Range (IQR) | $9,099 | $8,379 |
| Standard Deviation (Sample) | $9,981 | $7,970 |
| Standard Deviation (Population) | $9,950 | $7,901 |
Similar Demographics by Median Earnings
Demographics Similar to English by Median Earnings
In terms of median earnings, the demographic groups most similar to English are Puget Sound Salish ($46,333, a difference of 0.0%), Immigrants from Cameroon ($46,329, a difference of 0.010%), Colombian ($46,349, a difference of 0.030%), Swiss ($46,315, a difference of 0.040%), and French ($46,296, a difference of 0.080%).
| Demographics | Rating | Rank | Median Earnings |
| Kenyans | 51.0 /100 | #172 | Average $46,462 |
| Ghanaians | 50.3 /100 | #173 | Average $46,440 |
| Scandinavians | 50.0 /100 | #174 | Average $46,433 |
| Basques | 48.8 /100 | #175 | Average $46,399 |
| Danes | 48.6 /100 | #176 | Average $46,392 |
| Belgians | 48.0 /100 | #177 | Average $46,375 |
| Colombians | 47.1 /100 | #178 | Average $46,349 |
| English | 46.5 /100 | #179 | Average $46,334 |
| Puget Sound Salish | 46.5 /100 | #180 | Average $46,333 |
| Immigrants | Cameroon | 46.4 /100 | #181 | Average $46,329 |
| Swiss | 45.9 /100 | #182 | Average $46,315 |
| French | 45.2 /100 | #183 | Average $46,296 |
| Immigrants | Kenya | 42.4 /100 | #184 | Average $46,214 |
| Uruguayans | 41.6 /100 | #185 | Average $46,190 |
| Vietnamese | 40.9 /100 | #186 | Average $46,172 |
Demographics Similar to Mexican American Indians by Median Earnings
In terms of median earnings, the demographic groups most similar to Mexican American Indians are Immigrants from Nicaragua ($41,737, a difference of 0.040%), Indonesian ($41,701, a difference of 0.040%), Blackfeet ($41,822, a difference of 0.25%), Dominican ($41,864, a difference of 0.35%), and Immigrants from Dominican Republic ($41,554, a difference of 0.40%).
| Demographics | Rating | Rank | Median Earnings |
| Colville | 0.2 /100 | #279 | Tragic $42,151 |
| Hmong | 0.2 /100 | #280 | Tragic $42,111 |
| Marshallese | 0.2 /100 | #281 | Tragic $41,969 |
| Africans | 0.2 /100 | #282 | Tragic $41,955 |
| Dominicans | 0.2 /100 | #283 | Tragic $41,864 |
| Blackfeet | 0.2 /100 | #284 | Tragic $41,822 |
| Immigrants | Nicaragua | 0.1 /100 | #285 | Tragic $41,737 |
| Mexican American Indians | 0.1 /100 | #286 | Tragic $41,719 |
| Indonesians | 0.1 /100 | #287 | Tragic $41,701 |
| Immigrants | Dominican Republic | 0.1 /100 | #288 | Tragic $41,554 |
| Comanche | 0.1 /100 | #289 | Tragic $41,519 |
| Paiute | 0.1 /100 | #290 | Tragic $41,508 |
| Central American Indians | 0.1 /100 | #291 | Tragic $41,474 |
| U.S. Virgin Islanders | 0.1 /100 | #292 | Tragic $41,448 |
| Immigrants | Zaire | 0.1 /100 | #293 | Tragic $41,325 |