Immigrants from Venezuela vs Spanish 8th Grade
COMPARE
Immigrants from Venezuela
Spanish
8th Grade
8th Grade Comparison
Immigrants from Venezuela
Spanish
95.6%
8TH GRADE
30.8/ 100
METRIC RATING
190th/ 347
METRIC RANK
96.0%
8TH GRADE
85.1/ 100
METRIC RATING
143rd/ 347
METRIC RANK
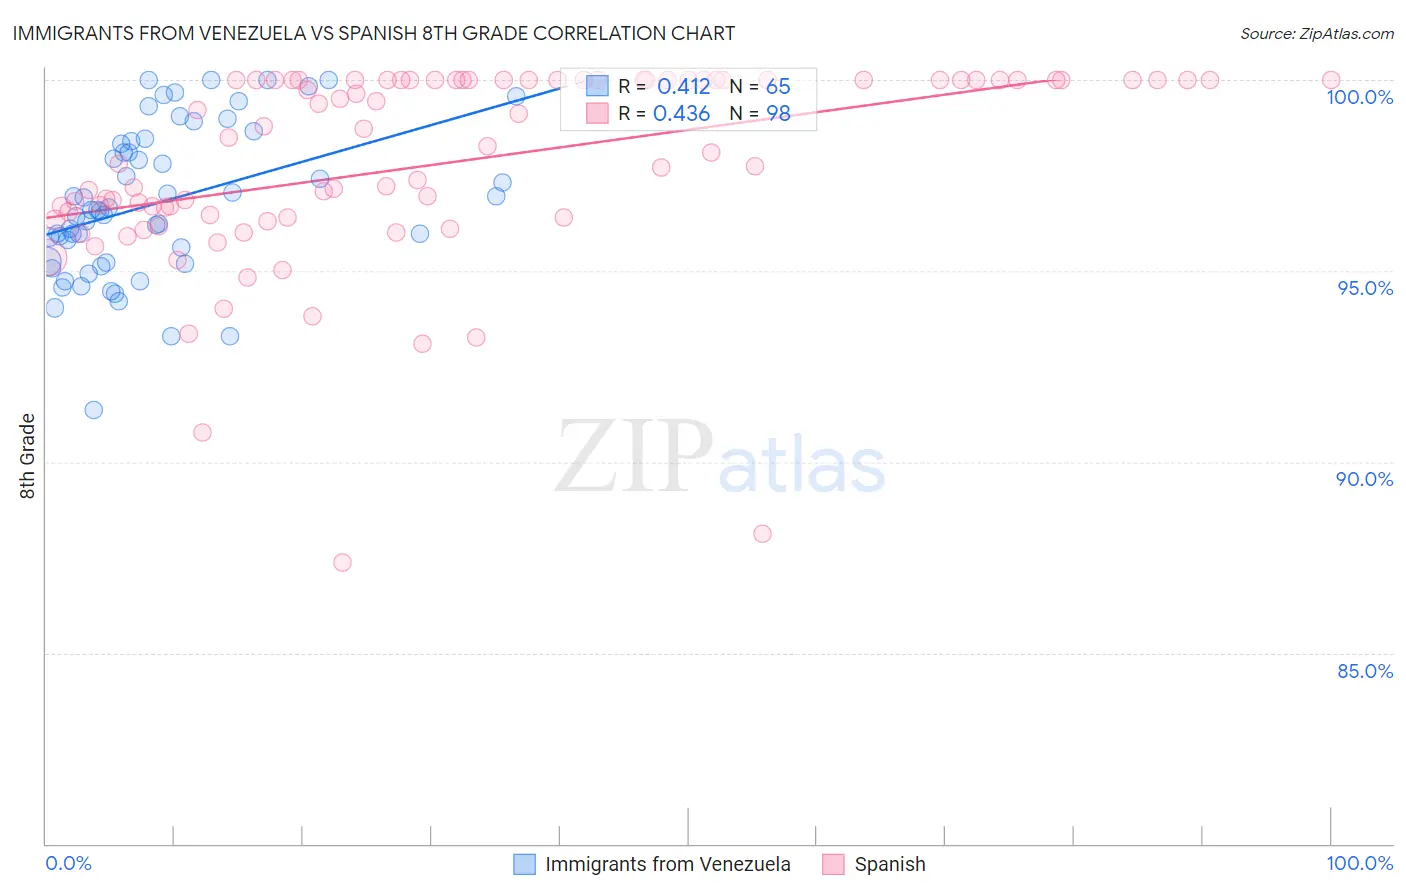
Immigrants from Venezuela vs Spanish 8th Grade Correlation Chart
The statistical analysis conducted on geographies consisting of 287,866,009 people shows a moderate positive correlation between the proportion of Immigrants from Venezuela and percentage of population with at least 8th grade education in the United States with a correlation coefficient (R) of 0.412 and weighted average of 95.6%. Similarly, the statistical analysis conducted on geographies consisting of 422,189,188 people shows a moderate positive correlation between the proportion of Spanish and percentage of population with at least 8th grade education in the United States with a correlation coefficient (R) of 0.436 and weighted average of 96.0%, a difference of 0.41%.
8th Grade Correlation Summary
| Measurement | Immigrants from Venezuela | Spanish |
| Minimum | 91.3% | 87.4% |
| Maximum | 100.0% | 100.0% |
| Range | 8.7% | 12.6% |
| Mean | 96.8% | 97.8% |
| Median | 96.6% | 98.4% |
| Interquartile 25% (IQ1) | 95.2% | 96.4% |
| Interquartile 75% (IQ3) | 98.4% | 100.0% |
| Interquartile Range (IQR) | 3.1% | 3.6% |
| Standard Deviation (Sample) | 2.0% | 2.6% |
| Standard Deviation (Population) | 1.9% | 2.6% |
Similar Demographics by 8th Grade
Demographics Similar to Immigrants from Venezuela by 8th Grade
In terms of 8th grade, the demographic groups most similar to Immigrants from Venezuela are Immigrants from Nepal (95.6%, a difference of 0.0%), Liberian (95.6%, a difference of 0.010%), Immigrants from Micronesia (95.6%, a difference of 0.010%), Sudanese (95.6%, a difference of 0.020%), and Pima (95.6%, a difference of 0.020%).
| Demographics | Rating | Rank | 8th Grade |
| Immigrants | Iraq | 36.2 /100 | #183 | Fair 95.6% |
| Immigrants | Uganda | 36.0 /100 | #184 | Fair 95.6% |
| Blacks/African Americans | 34.8 /100 | #185 | Fair 95.6% |
| Brazilians | 34.8 /100 | #186 | Fair 95.6% |
| Sudanese | 33.0 /100 | #187 | Fair 95.6% |
| Liberians | 32.4 /100 | #188 | Fair 95.6% |
| Immigrants | Micronesia | 31.6 /100 | #189 | Fair 95.6% |
| Immigrants | Venezuela | 30.8 /100 | #190 | Fair 95.6% |
| Immigrants | Nepal | 30.2 /100 | #191 | Fair 95.6% |
| Pima | 28.6 /100 | #192 | Fair 95.6% |
| Panamanians | 28.4 /100 | #193 | Fair 95.6% |
| Guamanians/Chamorros | 26.6 /100 | #194 | Fair 95.6% |
| Immigrants | Zaire | 25.2 /100 | #195 | Fair 95.6% |
| Assyrians/Chaldeans/Syriacs | 24.5 /100 | #196 | Fair 95.6% |
| Sierra Leoneans | 24.3 /100 | #197 | Fair 95.6% |
Demographics Similar to Spanish by 8th Grade
In terms of 8th grade, the demographic groups most similar to Spanish are Immigrants from Eastern Europe (96.0%, a difference of 0.0%), Immigrants from Belarus (96.0%, a difference of 0.0%), Immigrants from Greece (96.0%, a difference of 0.010%), Lumbee (96.0%, a difference of 0.010%), and Israeli (96.0%, a difference of 0.010%).
| Demographics | Rating | Rank | 8th Grade |
| Jordanians | 91.3 /100 | #136 | Exceptional 96.1% |
| Cambodians | 90.6 /100 | #137 | Exceptional 96.1% |
| Burmese | 90.2 /100 | #138 | Exceptional 96.1% |
| Hmong | 89.7 /100 | #139 | Excellent 96.1% |
| Immigrants | South Central Asia | 89.4 /100 | #140 | Excellent 96.1% |
| Immigrants | Greece | 85.9 /100 | #141 | Excellent 96.0% |
| Immigrants | Eastern Europe | 85.4 /100 | #142 | Excellent 96.0% |
| Spanish | 85.1 /100 | #143 | Excellent 96.0% |
| Immigrants | Belarus | 84.8 /100 | #144 | Excellent 96.0% |
| Lumbee | 84.1 /100 | #145 | Excellent 96.0% |
| Israelis | 84.1 /100 | #146 | Excellent 96.0% |
| Colville | 84.0 /100 | #147 | Excellent 96.0% |
| Albanians | 83.1 /100 | #148 | Excellent 96.0% |
| Immigrants | Israel | 81.3 /100 | #149 | Excellent 96.0% |
| Immigrants | Russia | 80.9 /100 | #150 | Excellent 96.0% |