Immigrants from Venezuela vs Spanish In Labor Force | Age 45-54
COMPARE
Immigrants from Venezuela
Spanish
In Labor Force | Age 45-54
In Labor Force | Age 45-54 Comparison
Immigrants from Venezuela
Spanish
83.7%
IN LABOR FORCE | AGE 45-54
99.4/ 100
METRIC RATING
38th/ 347
METRIC RANK
81.3%
IN LABOR FORCE | AGE 45-54
0.0/ 100
METRIC RATING
272nd/ 347
METRIC RANK
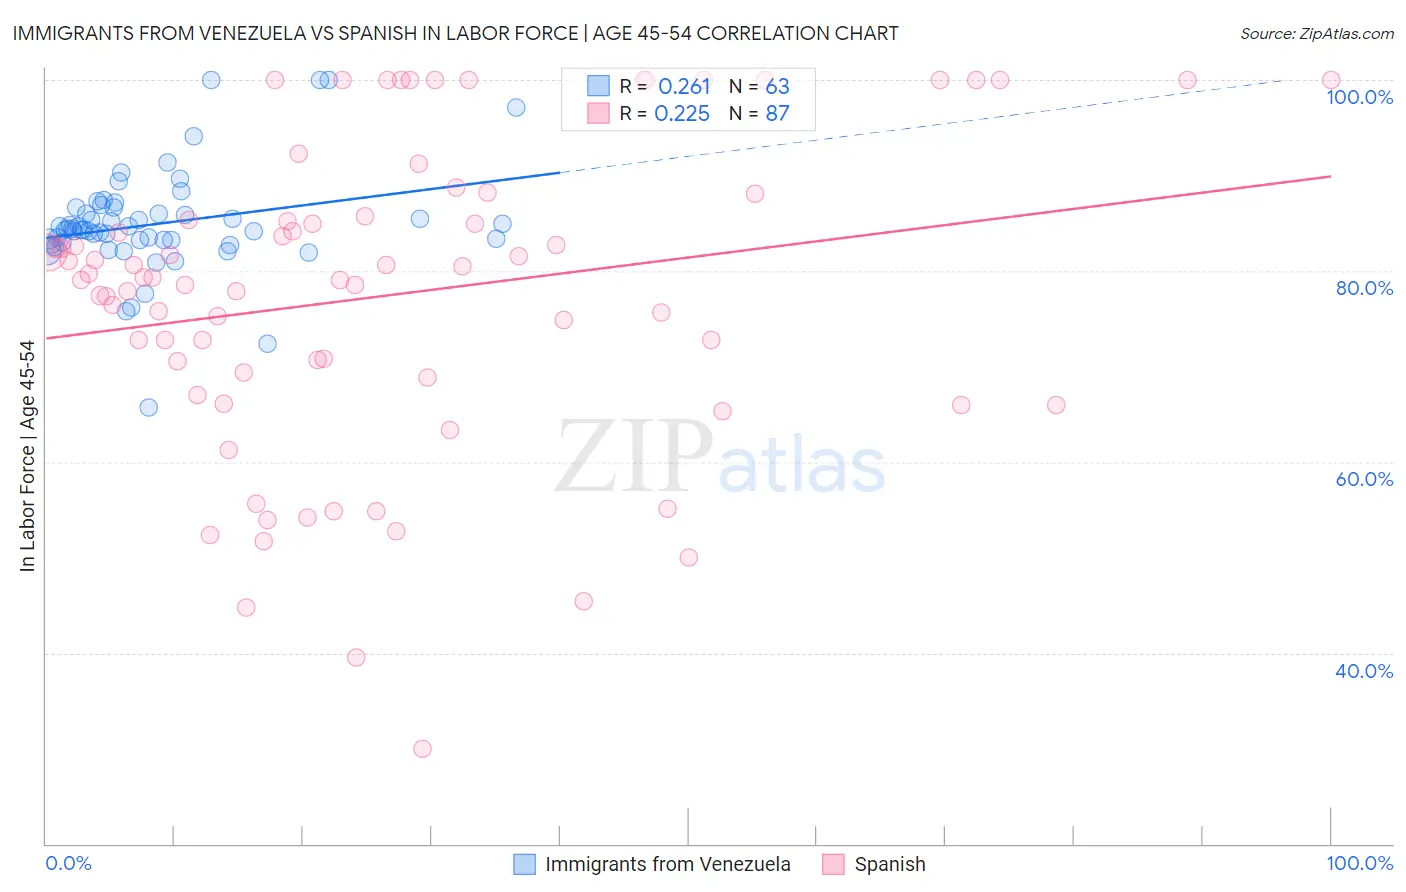
Immigrants from Venezuela vs Spanish In Labor Force | Age 45-54 Correlation Chart
The statistical analysis conducted on geographies consisting of 287,793,279 people shows a weak positive correlation between the proportion of Immigrants from Venezuela and labor force participation rate among population between the ages 45 and 54 in the United States with a correlation coefficient (R) of 0.261 and weighted average of 83.7%. Similarly, the statistical analysis conducted on geographies consisting of 421,899,220 people shows a weak positive correlation between the proportion of Spanish and labor force participation rate among population between the ages 45 and 54 in the United States with a correlation coefficient (R) of 0.225 and weighted average of 81.3%, a difference of 2.9%.
In Labor Force | Age 45-54 Correlation Summary
| Measurement | Immigrants from Venezuela | Spanish |
| Minimum | 65.7% | 30.0% |
| Maximum | 100.0% | 100.0% |
| Range | 34.3% | 70.0% |
| Mean | 84.9% | 77.5% |
| Median | 84.3% | 79.3% |
| Interquartile 25% (IQ1) | 82.9% | 68.8% |
| Interquartile 75% (IQ3) | 86.6% | 85.7% |
| Interquartile Range (IQR) | 3.7% | 16.9% |
| Standard Deviation (Sample) | 5.6% | 16.2% |
| Standard Deviation (Population) | 5.5% | 16.1% |
Similar Demographics by In Labor Force | Age 45-54
Demographics Similar to Immigrants from Venezuela by In Labor Force | Age 45-54
In terms of in labor force | age 45-54, the demographic groups most similar to Immigrants from Venezuela are Immigrants from Cuba (83.7%, a difference of 0.0%), Swedish (83.7%, a difference of 0.010%), Immigrants from Uganda (83.7%, a difference of 0.010%), Immigrants from Korea (83.7%, a difference of 0.020%), and Immigrants from Moldova (83.7%, a difference of 0.020%).
| Demographics | Rating | Rank | In Labor Force | Age 45-54 |
| Immigrants | Eritrea | 99.7 /100 | #31 | Exceptional 83.8% |
| Turks | 99.7 /100 | #32 | Exceptional 83.8% |
| Latvians | 99.7 /100 | #33 | Exceptional 83.8% |
| Kenyans | 99.5 /100 | #34 | Exceptional 83.7% |
| Brazilians | 99.5 /100 | #35 | Exceptional 83.7% |
| Ugandans | 99.5 /100 | #36 | Exceptional 83.7% |
| Swedes | 99.4 /100 | #37 | Exceptional 83.7% |
| Immigrants | Venezuela | 99.4 /100 | #38 | Exceptional 83.7% |
| Immigrants | Cuba | 99.4 /100 | #39 | Exceptional 83.7% |
| Immigrants | Uganda | 99.4 /100 | #40 | Exceptional 83.7% |
| Immigrants | Korea | 99.3 /100 | #41 | Exceptional 83.7% |
| Immigrants | Moldova | 99.3 /100 | #42 | Exceptional 83.7% |
| Venezuelans | 99.2 /100 | #43 | Exceptional 83.6% |
| Burmese | 99.1 /100 | #44 | Exceptional 83.6% |
| Immigrants | Hong Kong | 99.1 /100 | #45 | Exceptional 83.6% |
Demographics Similar to Spanish by In Labor Force | Age 45-54
In terms of in labor force | age 45-54, the demographic groups most similar to Spanish are Bangladeshi (81.3%, a difference of 0.010%), Immigrants from Barbados (81.3%, a difference of 0.010%), Alsatian (81.3%, a difference of 0.040%), Immigrants from Honduras (81.4%, a difference of 0.060%), and Chippewa (81.3%, a difference of 0.060%).
| Demographics | Rating | Rank | In Labor Force | Age 45-54 |
| Hondurans | 0.1 /100 | #265 | Tragic 81.4% |
| Immigrants | St. Vincent and the Grenadines | 0.1 /100 | #266 | Tragic 81.4% |
| West Indians | 0.1 /100 | #267 | Tragic 81.4% |
| Immigrants | Honduras | 0.0 /100 | #268 | Tragic 81.4% |
| Alsatians | 0.0 /100 | #269 | Tragic 81.3% |
| Bangladeshis | 0.0 /100 | #270 | Tragic 81.3% |
| Immigrants | Barbados | 0.0 /100 | #271 | Tragic 81.3% |
| Spanish | 0.0 /100 | #272 | Tragic 81.3% |
| Chippewa | 0.0 /100 | #273 | Tragic 81.3% |
| British West Indians | 0.0 /100 | #274 | Tragic 81.2% |
| Immigrants | Nonimmigrants | 0.0 /100 | #275 | Tragic 81.2% |
| U.S. Virgin Islanders | 0.0 /100 | #276 | Tragic 81.2% |
| Guatemalans | 0.0 /100 | #277 | Tragic 81.2% |
| Immigrants | Guatemala | 0.0 /100 | #278 | Tragic 81.1% |
| Immigrants | Micronesia | 0.0 /100 | #279 | Tragic 81.1% |