Immigrants from Venezuela vs Danish Median Female Earnings
COMPARE
Immigrants from Venezuela
Danish
Median Female Earnings
Median Female Earnings Comparison
Immigrants from Venezuela
Danes
$37,003
MEDIAN FEMALE EARNINGS
0.4/ 100
METRIC RATING
269th/ 347
METRIC RANK
$37,730
MEDIAN FEMALE EARNINGS
1.6/ 100
METRIC RATING
253rd/ 347
METRIC RANK
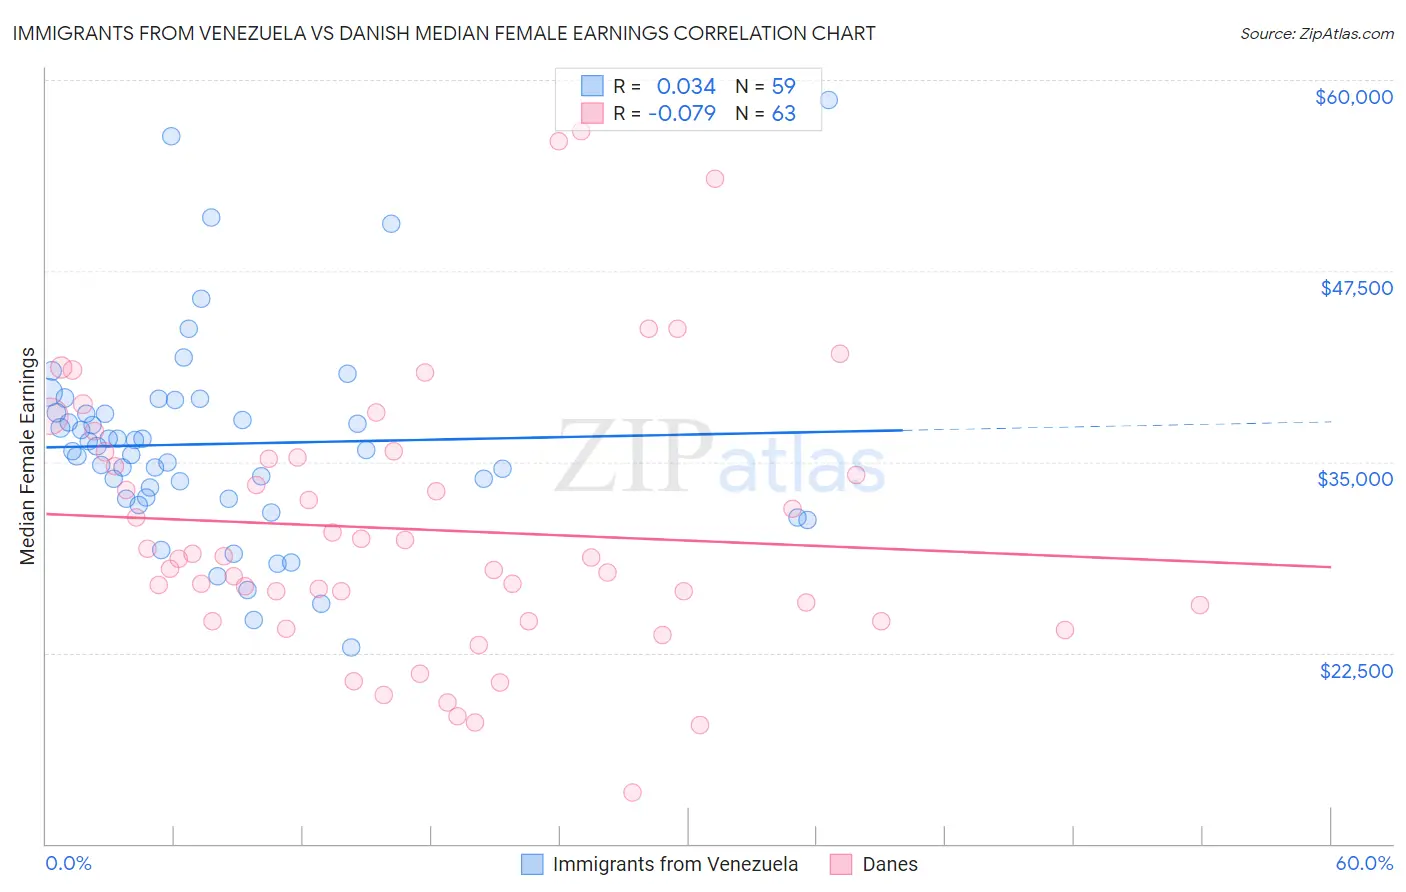
Immigrants from Venezuela vs Danish Median Female Earnings Correlation Chart
The statistical analysis conducted on geographies consisting of 287,813,755 people shows no correlation between the proportion of Immigrants from Venezuela and median female earnings in the United States with a correlation coefficient (R) of 0.034 and weighted average of $37,003. Similarly, the statistical analysis conducted on geographies consisting of 473,573,147 people shows a slight negative correlation between the proportion of Danes and median female earnings in the United States with a correlation coefficient (R) of -0.079 and weighted average of $37,730, a difference of 2.0%.
Median Female Earnings Correlation Summary
| Measurement | Immigrants from Venezuela | Danish |
| Minimum | $22,864 | $13,388 |
| Maximum | $58,709 | $56,667 |
| Range | $35,845 | $43,279 |
| Mean | $36,176 | $30,568 |
| Median | $35,750 | $28,750 |
| Interquartile 25% (IQ1) | $32,617 | $24,607 |
| Interquartile 75% (IQ3) | $38,204 | $35,286 |
| Interquartile Range (IQR) | $5,588 | $10,679 |
| Standard Deviation (Sample) | $6,703 | $8,841 |
| Standard Deviation (Population) | $6,646 | $8,771 |
Demographics Similar to Immigrants from Venezuela and Danes by Median Female Earnings
In terms of median female earnings, the demographic groups most similar to Immigrants from Venezuela are Cree ($37,018, a difference of 0.040%), Nonimmigrants ($37,024, a difference of 0.060%), Dominican ($37,046, a difference of 0.12%), Immigrants from Belize ($37,056, a difference of 0.14%), and Salvadoran ($37,083, a difference of 0.22%). Similarly, the demographic groups most similar to Danes are Immigrants from Dominica ($37,825, a difference of 0.25%), Welsh ($37,856, a difference of 0.33%), White/Caucasian ($37,531, a difference of 0.53%), Colville ($37,514, a difference of 0.58%), and Samoan ($37,498, a difference of 0.62%).
| Demographics | Rating | Rank | Median Female Earnings |
| Welsh | 2.1 /100 | #251 | Tragic $37,856 |
| Immigrants | Dominica | 2.0 /100 | #252 | Tragic $37,825 |
| Danes | 1.6 /100 | #253 | Tragic $37,730 |
| Whites/Caucasians | 1.1 /100 | #254 | Tragic $37,531 |
| Colville | 1.1 /100 | #255 | Tragic $37,514 |
| Samoans | 1.0 /100 | #256 | Tragic $37,498 |
| Hawaiians | 1.0 /100 | #257 | Tragic $37,497 |
| Belizeans | 0.9 /100 | #258 | Tragic $37,429 |
| Scotch-Irish | 0.8 /100 | #259 | Tragic $37,383 |
| Dutch | 0.7 /100 | #260 | Tragic $37,339 |
| Malaysians | 0.7 /100 | #261 | Tragic $37,298 |
| Venezuelans | 0.7 /100 | #262 | Tragic $37,282 |
| German Russians | 0.5 /100 | #263 | Tragic $37,105 |
| Salvadorans | 0.4 /100 | #264 | Tragic $37,083 |
| Immigrants | Belize | 0.4 /100 | #265 | Tragic $37,056 |
| Dominicans | 0.4 /100 | #266 | Tragic $37,046 |
| Immigrants | Nonimmigrants | 0.4 /100 | #267 | Tragic $37,024 |
| Cree | 0.4 /100 | #268 | Tragic $37,018 |
| Immigrants | Venezuela | 0.4 /100 | #269 | Tragic $37,003 |
| French American Indians | 0.3 /100 | #270 | Tragic $36,920 |
| Nicaraguans | 0.3 /100 | #271 | Tragic $36,904 |