Immigrants from Venezuela vs Danish Unemployment Among Ages 20 to 24 years
COMPARE
Immigrants from Venezuela
Danish
Unemployment Among Ages 20 to 24 years
Unemployment Among Ages 20 to 24 years Comparison
Immigrants from Venezuela
Danes
8.9%
UNEMPLOYMENT AMONG AGES 20 TO 24 YEARS
100.0/ 100
METRIC RATING
2nd/ 347
METRIC RANK
9.3%
UNEMPLOYMENT AMONG AGES 20 TO 24 YEARS
100.0/ 100
METRIC RATING
16th/ 347
METRIC RANK
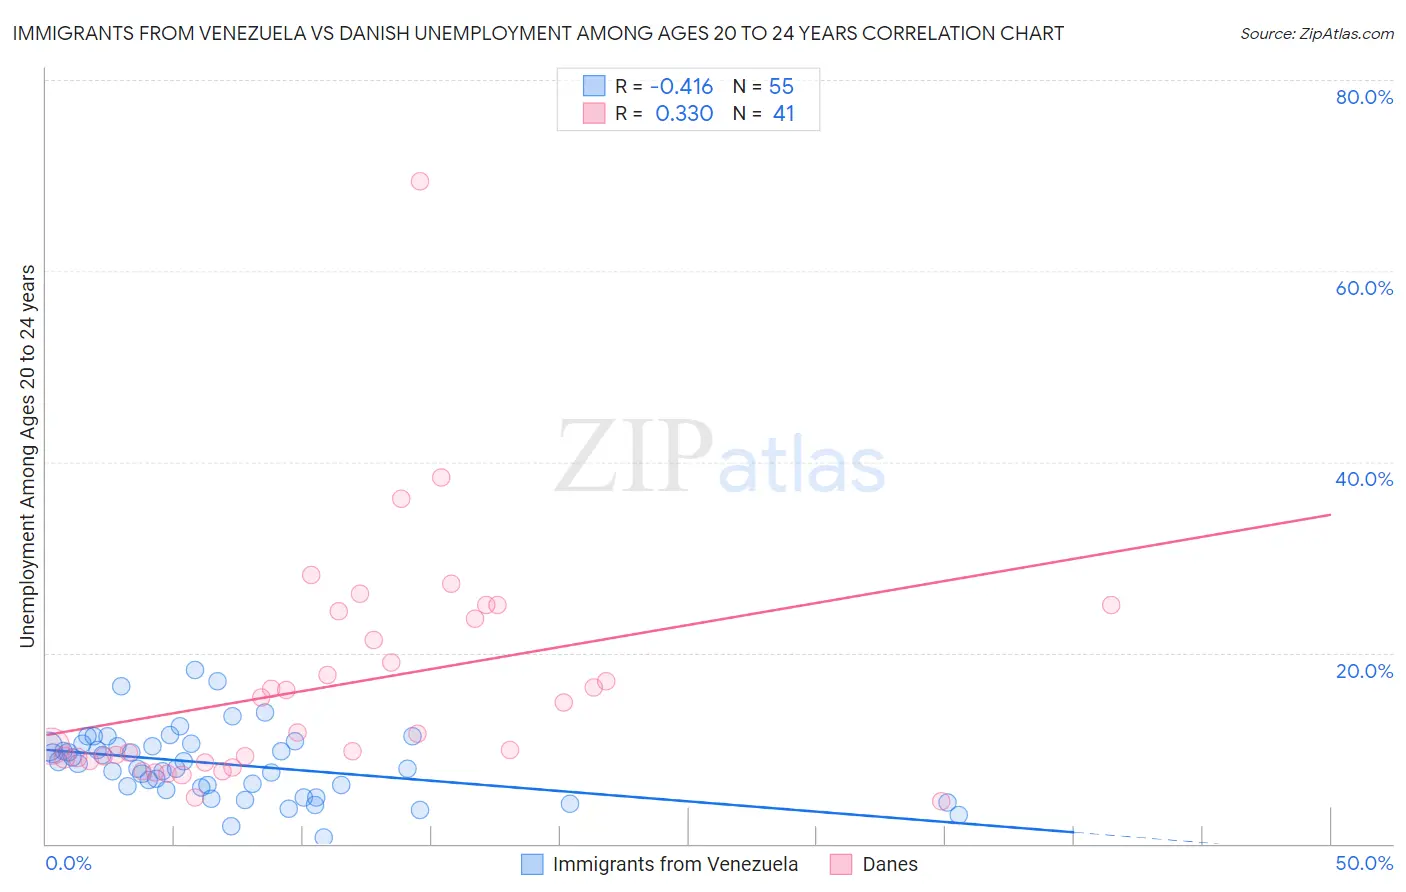
Immigrants from Venezuela vs Danish Unemployment Among Ages 20 to 24 years Correlation Chart
The statistical analysis conducted on geographies consisting of 282,850,918 people shows a moderate negative correlation between the proportion of Immigrants from Venezuela and unemployment rate among population between the ages 20 and 24 in the United States with a correlation coefficient (R) of -0.416 and weighted average of 8.9%. Similarly, the statistical analysis conducted on geographies consisting of 447,112,661 people shows a mild positive correlation between the proportion of Danes and unemployment rate among population between the ages 20 and 24 in the United States with a correlation coefficient (R) of 0.330 and weighted average of 9.3%, a difference of 4.3%.
Unemployment Among Ages 20 to 24 years Correlation Summary
| Measurement | Immigrants from Venezuela | Danish |
| Minimum | 0.60% | 4.5% |
| Maximum | 18.2% | 69.4% |
| Range | 17.6% | 64.9% |
| Mean | 8.3% | 16.6% |
| Median | 8.4% | 11.6% |
| Interquartile 25% (IQ1) | 5.9% | 8.9% |
| Interquartile 75% (IQ3) | 10.5% | 23.9% |
| Interquartile Range (IQR) | 4.5% | 15.1% |
| Standard Deviation (Sample) | 3.6% | 12.0% |
| Standard Deviation (Population) | 3.6% | 11.8% |
Demographics Similar to Immigrants from Venezuela and Danes by Unemployment Among Ages 20 to 24 years
In terms of unemployment among ages 20 to 24 years, the demographic groups most similar to Immigrants from Venezuela are Indonesian (9.0%, a difference of 1.0%), Venezuelan (9.0%, a difference of 1.3%), Norwegian (9.0%, a difference of 1.5%), Immigrants from Burma/Myanmar (9.1%, a difference of 2.1%), and Luxembourger (9.1%, a difference of 2.5%). Similarly, the demographic groups most similar to Danes are Immigrants from Sudan (9.3%, a difference of 0.16%), Slovene (9.3%, a difference of 0.19%), Czech (9.3%, a difference of 0.51%), Immigrants from Congo (9.2%, a difference of 0.57%), and Cuban (9.2%, a difference of 0.65%).
| Demographics | Rating | Rank | Unemployment Among Ages 20 to 24 years |
| Immigrants | Cuba | 100.0 /100 | #1 | Exceptional 8.7% |
| Immigrants | Venezuela | 100.0 /100 | #2 | Exceptional 8.9% |
| Indonesians | 100.0 /100 | #3 | Exceptional 9.0% |
| Venezuelans | 100.0 /100 | #4 | Exceptional 9.0% |
| Norwegians | 100.0 /100 | #5 | Exceptional 9.0% |
| Immigrants | Burma/Myanmar | 100.0 /100 | #6 | Exceptional 9.1% |
| Luxembourgers | 100.0 /100 | #7 | Exceptional 9.1% |
| Somalis | 100.0 /100 | #8 | Exceptional 9.1% |
| Immigrants | Somalia | 100.0 /100 | #9 | Exceptional 9.2% |
| Sudanese | 100.0 /100 | #10 | Exceptional 9.2% |
| Zimbabweans | 100.0 /100 | #11 | Exceptional 9.2% |
| Cubans | 100.0 /100 | #12 | Exceptional 9.2% |
| Immigrants | Congo | 100.0 /100 | #13 | Exceptional 9.2% |
| Slovenes | 100.0 /100 | #14 | Exceptional 9.3% |
| Immigrants | Sudan | 100.0 /100 | #15 | Exceptional 9.3% |
| Danes | 100.0 /100 | #16 | Exceptional 9.3% |
| Czechs | 100.0 /100 | #17 | Exceptional 9.3% |
| Chinese | 100.0 /100 | #18 | Exceptional 9.4% |
| Hmong | 100.0 /100 | #19 | Exceptional 9.4% |
| Osage | 100.0 /100 | #20 | Exceptional 9.4% |