British vs Danish Median Female Earnings
COMPARE
British
Danish
Median Female Earnings
Median Female Earnings Comparison
British
Danes
$39,772
MEDIAN FEMALE EARNINGS
53.8/ 100
METRIC RATING
172nd/ 347
METRIC RANK
$37,730
MEDIAN FEMALE EARNINGS
1.6/ 100
METRIC RATING
253rd/ 347
METRIC RANK
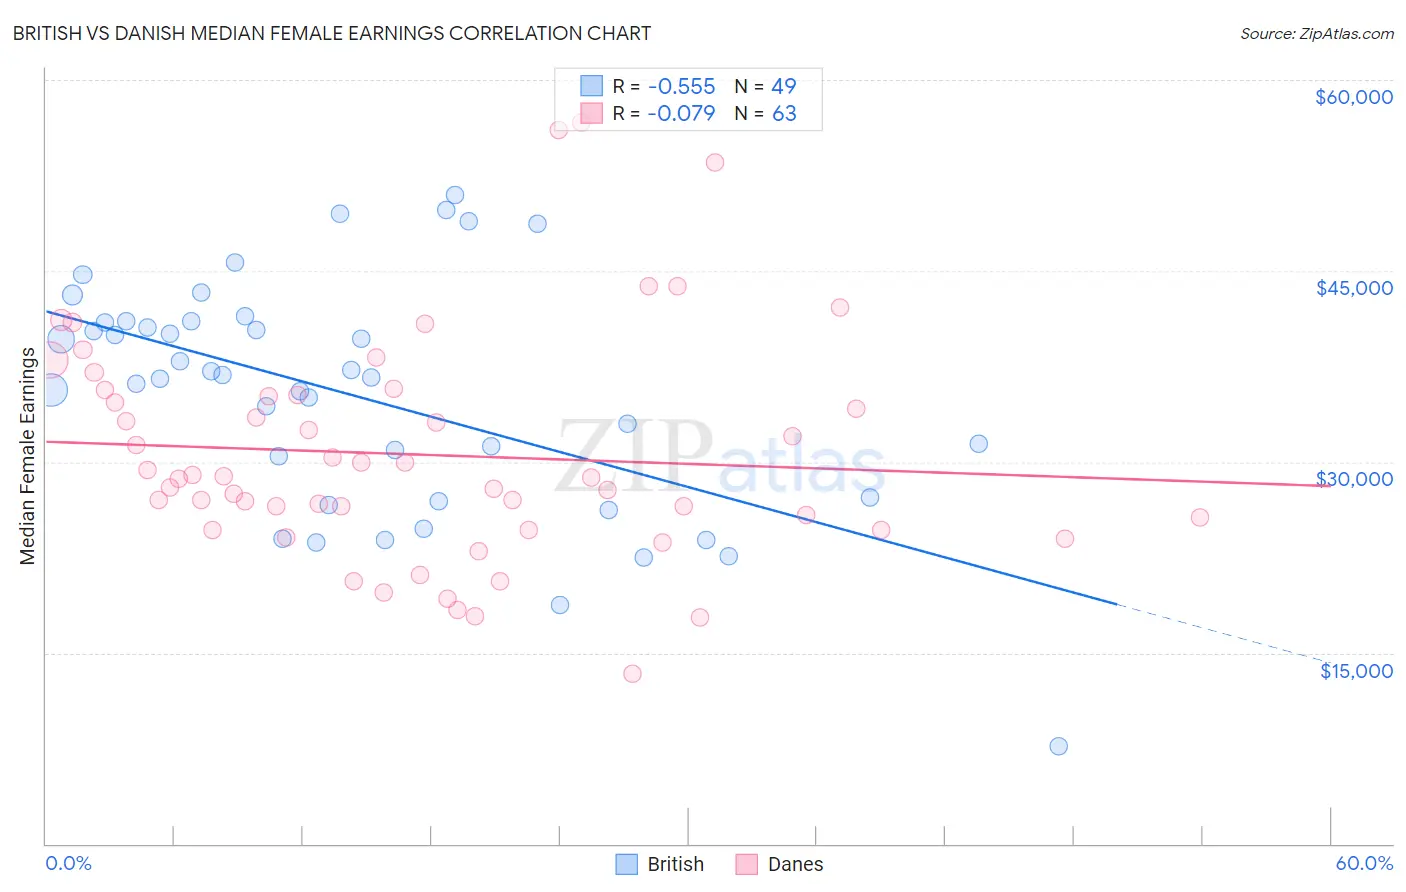
British vs Danish Median Female Earnings Correlation Chart
The statistical analysis conducted on geographies consisting of 530,644,409 people shows a substantial negative correlation between the proportion of British and median female earnings in the United States with a correlation coefficient (R) of -0.555 and weighted average of $39,772. Similarly, the statistical analysis conducted on geographies consisting of 473,573,147 people shows a slight negative correlation between the proportion of Danes and median female earnings in the United States with a correlation coefficient (R) of -0.079 and weighted average of $37,730, a difference of 5.4%.
Median Female Earnings Correlation Summary
| Measurement | British | Danish |
| Minimum | $7,631 | $13,388 |
| Maximum | $50,972 | $56,667 |
| Range | $43,341 | $43,279 |
| Mean | $35,190 | $30,568 |
| Median | $36,667 | $28,750 |
| Interquartile 25% (IQ1) | $27,044 | $24,607 |
| Interquartile 75% (IQ3) | $41,037 | $35,286 |
| Interquartile Range (IQR) | $13,994 | $10,679 |
| Standard Deviation (Sample) | $9,173 | $8,841 |
| Standard Deviation (Population) | $9,079 | $8,771 |
Similar Demographics by Median Female Earnings
Demographics Similar to British by Median Female Earnings
In terms of median female earnings, the demographic groups most similar to British are Immigrants from Portugal ($39,788, a difference of 0.040%), Slovene ($39,817, a difference of 0.11%), Canadian ($39,724, a difference of 0.12%), South American ($39,698, a difference of 0.19%), and Kenyan ($39,860, a difference of 0.22%).
| Demographics | Rating | Rank | Median Female Earnings |
| Immigrants | Bangladesh | 60.8 /100 | #165 | Good $39,910 |
| Immigrants | Ghana | 60.0 /100 | #166 | Good $39,894 |
| Luxembourgers | 59.9 /100 | #167 | Average $39,891 |
| Immigrants | Peru | 58.9 /100 | #168 | Average $39,871 |
| Kenyans | 58.4 /100 | #169 | Average $39,860 |
| Slovenes | 56.2 /100 | #170 | Average $39,817 |
| Immigrants | Portugal | 54.7 /100 | #171 | Average $39,788 |
| British | 53.8 /100 | #172 | Average $39,772 |
| Canadians | 51.4 /100 | #173 | Average $39,724 |
| South Americans | 50.0 /100 | #174 | Average $39,698 |
| Immigrants | South America | 47.2 /100 | #175 | Average $39,643 |
| Nigerians | 47.0 /100 | #176 | Average $39,641 |
| Costa Ricans | 46.1 /100 | #177 | Average $39,622 |
| Slavs | 45.6 /100 | #178 | Average $39,613 |
| Immigrants | Germany | 45.1 /100 | #179 | Average $39,603 |
Demographics Similar to Danes by Median Female Earnings
In terms of median female earnings, the demographic groups most similar to Danes are Immigrants from Dominica ($37,825, a difference of 0.25%), Welsh ($37,856, a difference of 0.33%), Immigrants from Iraq ($37,864, a difference of 0.35%), Alaskan Athabascan ($37,905, a difference of 0.46%), and Swiss ($37,904, a difference of 0.46%).
| Demographics | Rating | Rank | Median Female Earnings |
| Delaware | 2.6 /100 | #246 | Tragic $37,964 |
| Immigrants | Somalia | 2.4 /100 | #247 | Tragic $37,914 |
| Alaskan Athabascans | 2.3 /100 | #248 | Tragic $37,905 |
| Swiss | 2.3 /100 | #249 | Tragic $37,904 |
| Immigrants | Iraq | 2.2 /100 | #250 | Tragic $37,864 |
| Welsh | 2.1 /100 | #251 | Tragic $37,856 |
| Immigrants | Dominica | 2.0 /100 | #252 | Tragic $37,825 |
| Danes | 1.6 /100 | #253 | Tragic $37,730 |
| Whites/Caucasians | 1.1 /100 | #254 | Tragic $37,531 |
| Colville | 1.1 /100 | #255 | Tragic $37,514 |
| Samoans | 1.0 /100 | #256 | Tragic $37,498 |
| Hawaiians | 1.0 /100 | #257 | Tragic $37,497 |
| Belizeans | 0.9 /100 | #258 | Tragic $37,429 |
| Scotch-Irish | 0.8 /100 | #259 | Tragic $37,383 |
| Dutch | 0.7 /100 | #260 | Tragic $37,339 |