Immigrants from Korea vs Barbadian Median Male Earnings
COMPARE
Immigrants from Korea
Barbadian
Median Male Earnings
Median Male Earnings Comparison
Immigrants from Korea
Barbadians
$65,079
MEDIAN MALE EARNINGS
100.0/ 100
METRIC RATING
23rd/ 347
METRIC RANK
$51,236
MEDIAN MALE EARNINGS
3.9/ 100
METRIC RATING
231st/ 347
METRIC RANK
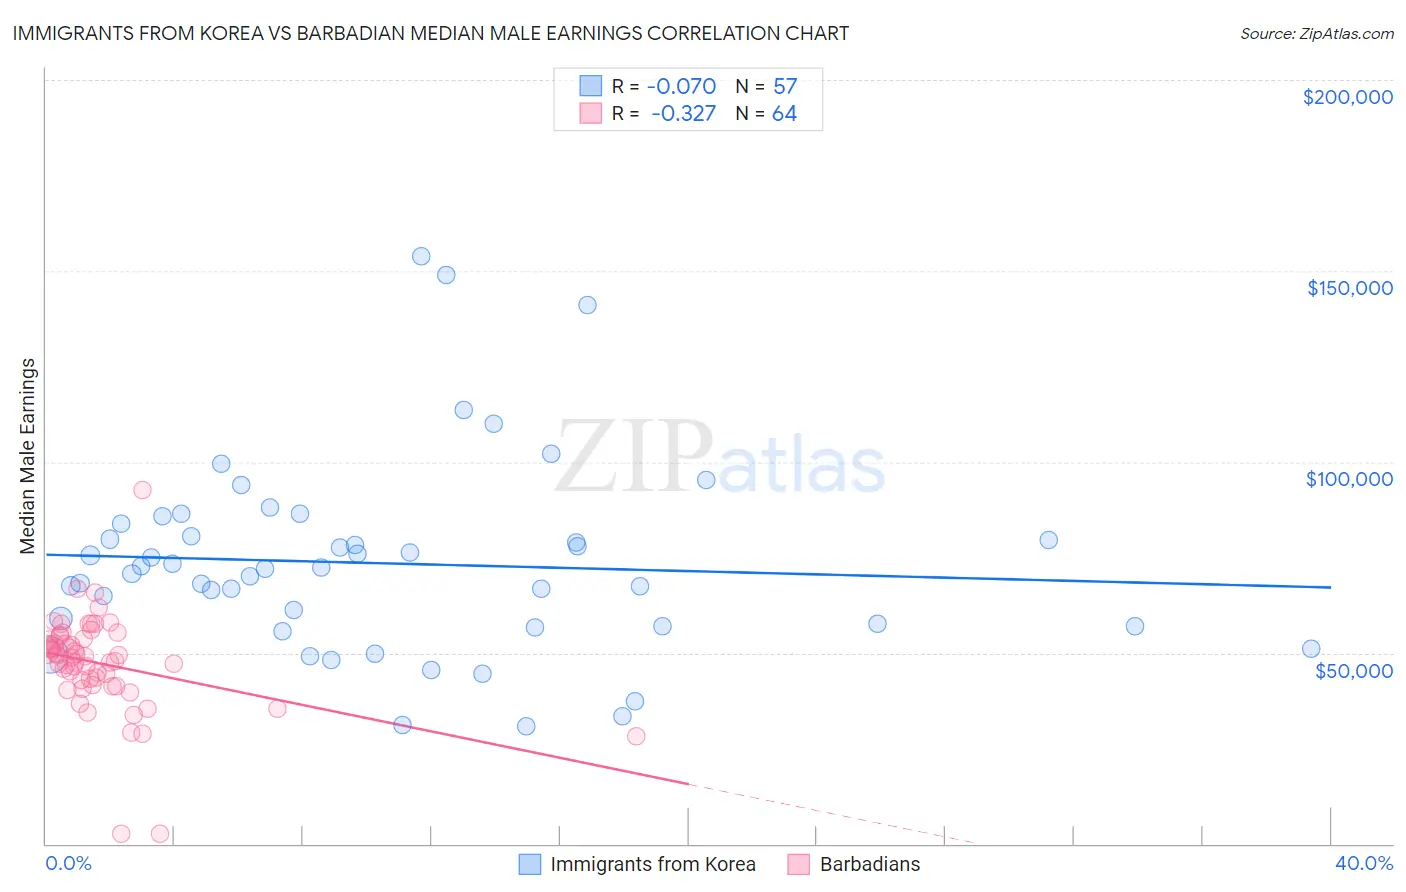
Immigrants from Korea vs Barbadian Median Male Earnings Correlation Chart
The statistical analysis conducted on geographies consisting of 416,203,155 people shows a slight negative correlation between the proportion of Immigrants from Korea and median male earnings in the United States with a correlation coefficient (R) of -0.070 and weighted average of $65,079. Similarly, the statistical analysis conducted on geographies consisting of 141,271,676 people shows a mild negative correlation between the proportion of Barbadians and median male earnings in the United States with a correlation coefficient (R) of -0.327 and weighted average of $51,236, a difference of 27.0%.
Median Male Earnings Correlation Summary
| Measurement | Immigrants from Korea | Barbadian |
| Minimum | $30,795 | $2,499 |
| Maximum | $153,870 | $92,582 |
| Range | $123,075 | $90,083 |
| Mean | $73,429 | $47,251 |
| Median | $71,921 | $48,821 |
| Interquartile 25% (IQ1) | $56,978 | $42,256 |
| Interquartile 75% (IQ3) | $82,188 | $53,422 |
| Interquartile Range (IQR) | $25,211 | $11,166 |
| Standard Deviation (Sample) | $25,444 | $12,825 |
| Standard Deviation (Population) | $25,220 | $12,724 |
Similar Demographics by Median Male Earnings
Demographics Similar to Immigrants from Korea by Median Male Earnings
In terms of median male earnings, the demographic groups most similar to Immigrants from Korea are Immigrants from Northern Europe ($64,987, a difference of 0.14%), Burmese ($65,236, a difference of 0.24%), Immigrants from Sweden ($65,406, a difference of 0.50%), Immigrants from Japan ($65,518, a difference of 0.67%), and Immigrants from Denmark ($64,625, a difference of 0.70%).
| Demographics | Rating | Rank | Median Male Earnings |
| Eastern Europeans | 100.0 /100 | #16 | Exceptional $66,472 |
| Immigrants | Belgium | 100.0 /100 | #17 | Exceptional $66,125 |
| Indians (Asian) | 100.0 /100 | #18 | Exceptional $66,078 |
| Cypriots | 100.0 /100 | #19 | Exceptional $65,549 |
| Immigrants | Japan | 100.0 /100 | #20 | Exceptional $65,518 |
| Immigrants | Sweden | 100.0 /100 | #21 | Exceptional $65,406 |
| Burmese | 100.0 /100 | #22 | Exceptional $65,236 |
| Immigrants | Korea | 100.0 /100 | #23 | Exceptional $65,079 |
| Immigrants | Northern Europe | 100.0 /100 | #24 | Exceptional $64,987 |
| Immigrants | Denmark | 100.0 /100 | #25 | Exceptional $64,625 |
| Turks | 100.0 /100 | #26 | Exceptional $64,253 |
| Immigrants | Switzerland | 100.0 /100 | #27 | Exceptional $63,944 |
| Russians | 100.0 /100 | #28 | Exceptional $63,939 |
| Asians | 100.0 /100 | #29 | Exceptional $63,827 |
| Immigrants | France | 100.0 /100 | #30 | Exceptional $63,715 |
Demographics Similar to Barbadians by Median Male Earnings
In terms of median male earnings, the demographic groups most similar to Barbadians are Sudanese ($51,216, a difference of 0.040%), Aleut ($51,168, a difference of 0.13%), Immigrants from Nigeria ($51,310, a difference of 0.14%), Cape Verdean ($51,103, a difference of 0.26%), and Immigrants from Trinidad and Tobago ($51,376, a difference of 0.27%).
| Demographics | Rating | Rank | Median Male Earnings |
| Immigrants | Cambodia | 5.5 /100 | #224 | Tragic $51,594 |
| Immigrants | Sudan | 5.0 /100 | #225 | Tragic $51,489 |
| Japanese | 4.9 /100 | #226 | Tragic $51,473 |
| Trinidadians and Tobagonians | 4.8 /100 | #227 | Tragic $51,446 |
| Samoans | 4.6 /100 | #228 | Tragic $51,389 |
| Immigrants | Trinidad and Tobago | 4.5 /100 | #229 | Tragic $51,376 |
| Immigrants | Nigeria | 4.2 /100 | #230 | Tragic $51,310 |
| Barbadians | 3.9 /100 | #231 | Tragic $51,236 |
| Sudanese | 3.9 /100 | #232 | Tragic $51,216 |
| Aleuts | 3.7 /100 | #233 | Tragic $51,168 |
| Cape Verdeans | 3.5 /100 | #234 | Tragic $51,103 |
| Immigrants | Western Africa | 3.0 /100 | #235 | Tragic $50,940 |
| Pennsylvania Germans | 2.8 /100 | #236 | Tragic $50,878 |
| Immigrants | Barbados | 2.6 /100 | #237 | Tragic $50,795 |
| Malaysians | 2.5 /100 | #238 | Tragic $50,772 |