African vs Moroccan Householder Income Ages 45 - 64 years
COMPARE
African
Moroccan
Householder Income Ages 45 - 64 years
Householder Income Ages 45 - 64 years Comparison
Africans
Moroccans
$84,925
HOUSEHOLDER INCOME AGES 45 - 64 YEARS
0.0/ 100
METRIC RATING
298th/ 347
METRIC RANK
$100,138
HOUSEHOLDER INCOME AGES 45 - 64 YEARS
47.7/ 100
METRIC RATING
177th/ 347
METRIC RANK
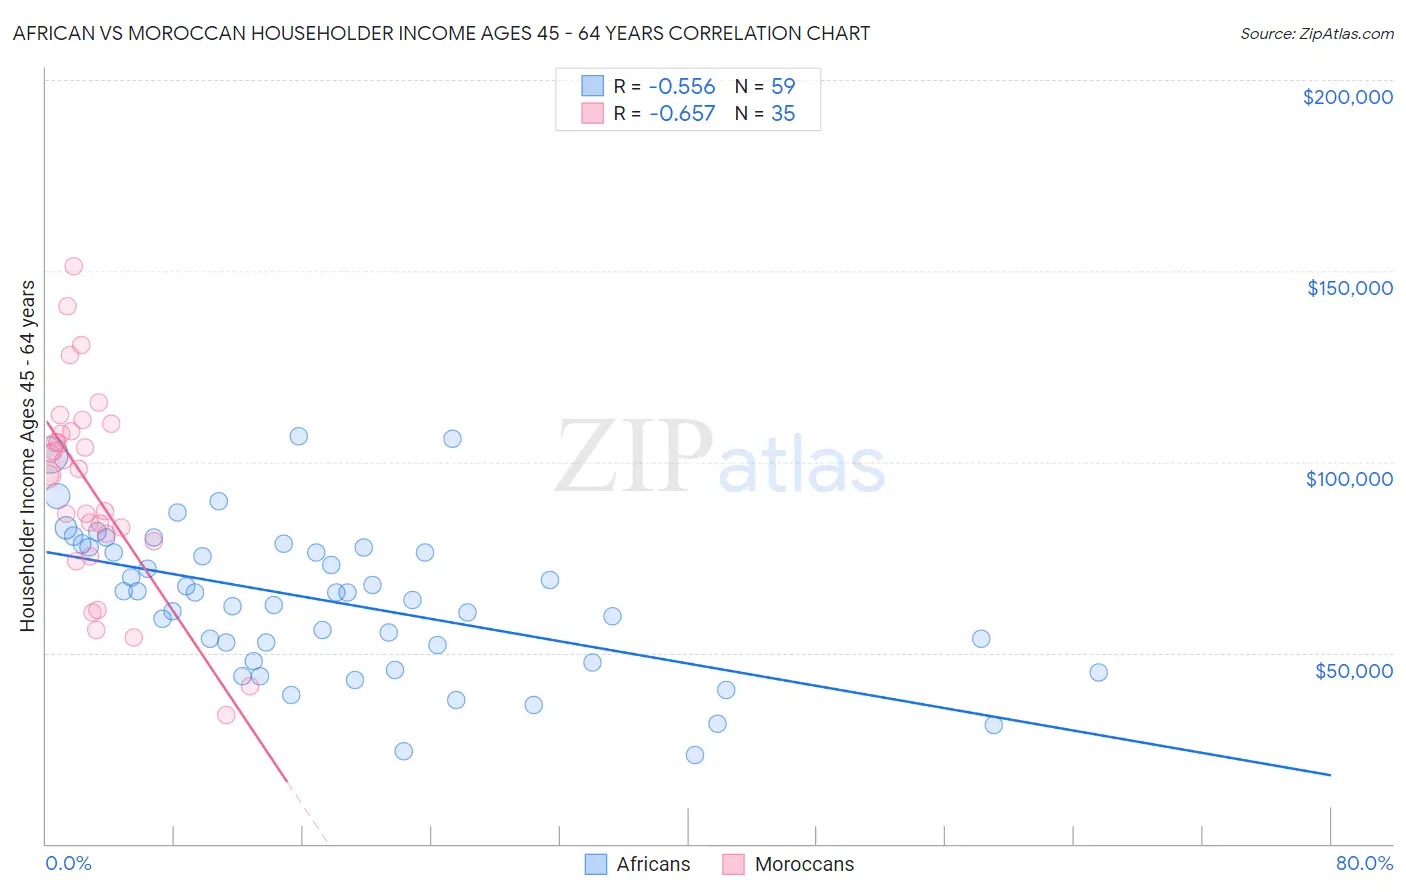
African vs Moroccan Householder Income Ages 45 - 64 years Correlation Chart
The statistical analysis conducted on geographies consisting of 468,468,488 people shows a substantial negative correlation between the proportion of Africans and household income with householder between the ages 45 and 64 in the United States with a correlation coefficient (R) of -0.556 and weighted average of $84,925. Similarly, the statistical analysis conducted on geographies consisting of 201,649,728 people shows a significant negative correlation between the proportion of Moroccans and household income with householder between the ages 45 and 64 in the United States with a correlation coefficient (R) of -0.657 and weighted average of $100,138, a difference of 17.9%.
Householder Income Ages 45 - 64 years Correlation Summary
| Measurement | African | Moroccan |
| Minimum | $23,133 | $33,750 |
| Maximum | $106,630 | $151,275 |
| Range | $83,497 | $117,525 |
| Mean | $63,321 | $92,917 |
| Median | $65,668 | $96,708 |
| Interquartile 25% (IQ1) | $47,695 | $79,167 |
| Interquartile 75% (IQ3) | $77,568 | $108,085 |
| Interquartile Range (IQR) | $29,873 | $28,918 |
| Standard Deviation (Sample) | $19,169 | $26,273 |
| Standard Deviation (Population) | $19,006 | $25,895 |
Similar Demographics by Householder Income Ages 45 - 64 years
Demographics Similar to Africans by Householder Income Ages 45 - 64 years
In terms of householder income ages 45 - 64 years, the demographic groups most similar to Africans are Immigrants from Mexico ($84,910, a difference of 0.020%), Indonesian ($84,890, a difference of 0.040%), Fijian ($85,187, a difference of 0.31%), Immigrants from Zaire ($85,207, a difference of 0.33%), and Potawatomi ($84,613, a difference of 0.37%).
| Demographics | Rating | Rank | Householder Income Ages 45 - 64 years |
| Hispanics or Latinos | 0.1 /100 | #291 | Tragic $86,006 |
| Immigrants | Central America | 0.1 /100 | #292 | Tragic $85,965 |
| Comanche | 0.1 /100 | #293 | Tragic $85,787 |
| British West Indians | 0.1 /100 | #294 | Tragic $85,571 |
| Immigrants | Grenada | 0.1 /100 | #295 | Tragic $85,552 |
| Immigrants | Zaire | 0.1 /100 | #296 | Tragic $85,207 |
| Fijians | 0.1 /100 | #297 | Tragic $85,187 |
| Africans | 0.0 /100 | #298 | Tragic $84,925 |
| Immigrants | Mexico | 0.0 /100 | #299 | Tragic $84,910 |
| Indonesians | 0.0 /100 | #300 | Tragic $84,890 |
| Potawatomi | 0.0 /100 | #301 | Tragic $84,613 |
| Haitians | 0.0 /100 | #302 | Tragic $84,384 |
| Hondurans | 0.0 /100 | #303 | Tragic $84,079 |
| Ottawa | 0.0 /100 | #304 | Tragic $83,953 |
| Chippewa | 0.0 /100 | #305 | Tragic $83,943 |
Demographics Similar to Moroccans by Householder Income Ages 45 - 64 years
In terms of householder income ages 45 - 64 years, the demographic groups most similar to Moroccans are Immigrants from Costa Rica ($100,141, a difference of 0.0%), Immigrants from Cameroon ($100,084, a difference of 0.050%), Belgian ($100,060, a difference of 0.080%), German ($100,224, a difference of 0.090%), and Aleut ($100,052, a difference of 0.090%).
| Demographics | Rating | Rank | Householder Income Ages 45 - 64 years |
| Slovaks | 58.8 /100 | #170 | Average $101,029 |
| South Americans | 56.4 /100 | #171 | Average $100,837 |
| Immigrants | Uzbekistan | 52.5 /100 | #172 | Average $100,523 |
| Alsatians | 51.4 /100 | #173 | Average $100,435 |
| Welsh | 50.0 /100 | #174 | Average $100,322 |
| Germans | 48.8 /100 | #175 | Average $100,224 |
| Immigrants | Costa Rica | 47.7 /100 | #176 | Average $100,141 |
| Moroccans | 47.7 /100 | #177 | Average $100,138 |
| Immigrants | Cameroon | 47.0 /100 | #178 | Average $100,084 |
| Belgians | 46.7 /100 | #179 | Average $100,060 |
| Aleuts | 46.6 /100 | #180 | Average $100,052 |
| Immigrants | Immigrants | 45.3 /100 | #181 | Average $99,943 |
| Finns | 44.8 /100 | #182 | Average $99,904 |
| Spaniards | 44.6 /100 | #183 | Average $99,889 |
| French | 43.8 /100 | #184 | Average $99,824 |