Bahamian vs Honduran Householder Income Ages 25 - 44 years
COMPARE
Bahamian
Honduran
Householder Income Ages 25 - 44 years
Householder Income Ages 25 - 44 years Comparison
Bahamians
Hondurans
$75,395
HOUSEHOLDER INCOME AGES 25 - 44 YEARS
0.0/ 100
METRIC RATING
332nd/ 347
METRIC RANK
$78,540
HOUSEHOLDER INCOME AGES 25 - 44 YEARS
0.0/ 100
METRIC RATING
319th/ 347
METRIC RANK
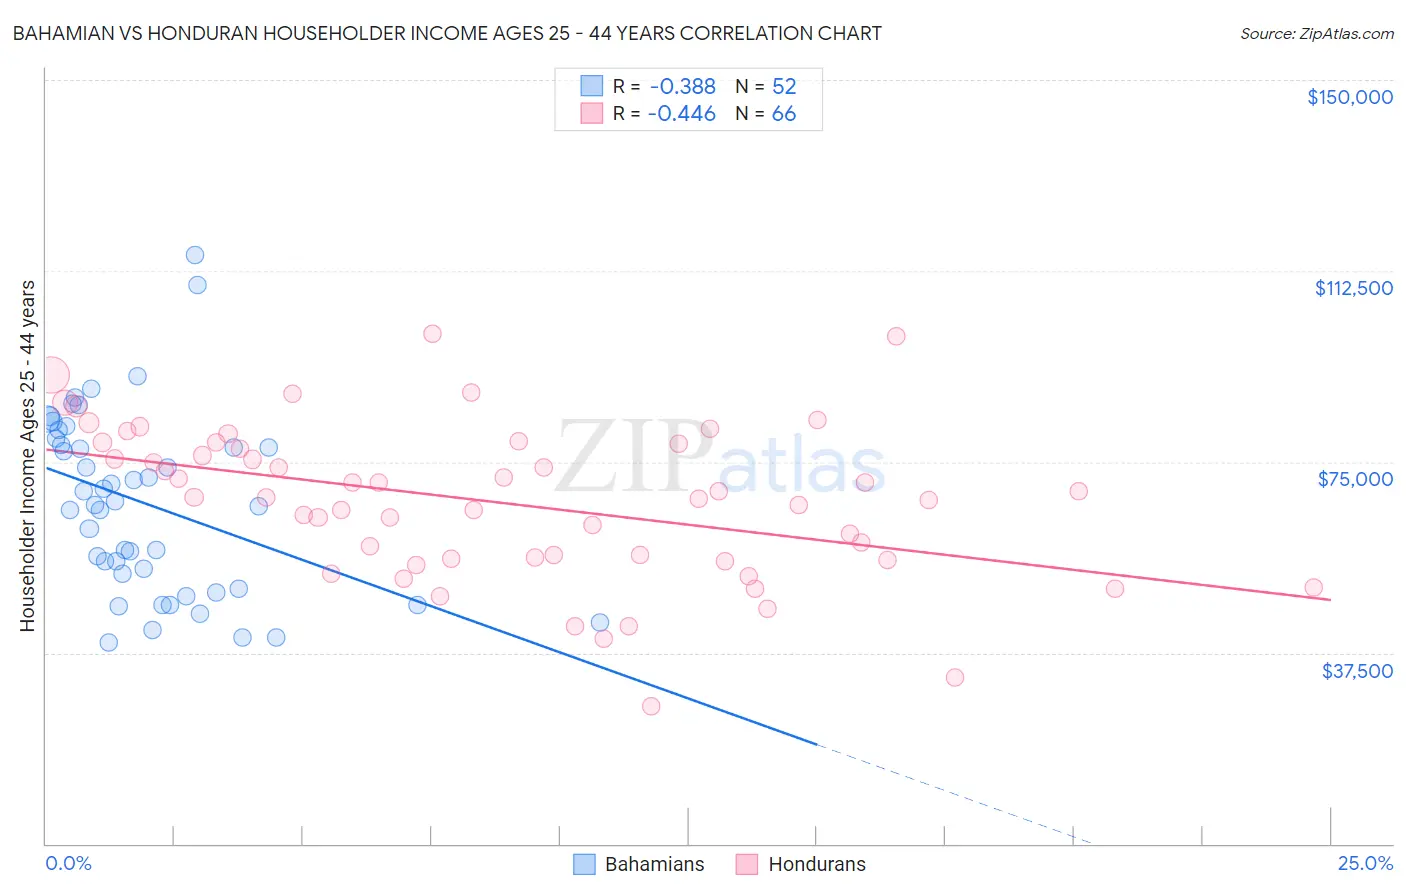
Bahamian vs Honduran Householder Income Ages 25 - 44 years Correlation Chart
The statistical analysis conducted on geographies consisting of 112,379,303 people shows a mild negative correlation between the proportion of Bahamians and household income with householder between the ages 25 and 44 in the United States with a correlation coefficient (R) of -0.388 and weighted average of $75,395. Similarly, the statistical analysis conducted on geographies consisting of 357,079,818 people shows a moderate negative correlation between the proportion of Hondurans and household income with householder between the ages 25 and 44 in the United States with a correlation coefficient (R) of -0.446 and weighted average of $78,540, a difference of 4.2%.
Householder Income Ages 25 - 44 years Correlation Summary
| Measurement | Bahamian | Honduran |
| Minimum | $39,485 | $26,956 |
| Maximum | $115,565 | $100,173 |
| Range | $76,080 | $73,217 |
| Mean | $66,851 | $67,051 |
| Median | $66,950 | $68,041 |
| Interquartile 25% (IQ1) | $51,594 | $56,015 |
| Interquartile 75% (IQ3) | $78,952 | $78,438 |
| Interquartile Range (IQR) | $27,358 | $22,423 |
| Standard Deviation (Sample) | $17,732 | $15,191 |
| Standard Deviation (Population) | $17,561 | $15,075 |
Demographics Similar to Bahamians and Hondurans by Householder Income Ages 25 - 44 years
In terms of householder income ages 25 - 44 years, the demographic groups most similar to Bahamians are Native/Alaskan ($75,647, a difference of 0.34%), Hopi ($75,002, a difference of 0.52%), Creek ($74,847, a difference of 0.73%), Kiowa ($74,776, a difference of 0.83%), and Yakama ($76,226, a difference of 1.1%). Similarly, the demographic groups most similar to Hondurans are Immigrants from Mexico ($78,809, a difference of 0.34%), U.S. Virgin Islander ($78,911, a difference of 0.47%), Choctaw ($78,168, a difference of 0.48%), African ($78,986, a difference of 0.57%), and Ottawa ($79,012, a difference of 0.60%).
| Demographics | Rating | Rank | Householder Income Ages 25 - 44 years |
| Ottawa | 0.0 /100 | #315 | Tragic $79,012 |
| Africans | 0.0 /100 | #316 | Tragic $78,986 |
| U.S. Virgin Islanders | 0.0 /100 | #317 | Tragic $78,911 |
| Immigrants | Mexico | 0.0 /100 | #318 | Tragic $78,809 |
| Hondurans | 0.0 /100 | #319 | Tragic $78,540 |
| Choctaw | 0.0 /100 | #320 | Tragic $78,168 |
| Immigrants | Zaire | 0.0 /100 | #321 | Tragic $78,045 |
| Chickasaw | 0.0 /100 | #322 | Tragic $77,929 |
| Immigrants | Honduras | 0.0 /100 | #323 | Tragic $77,328 |
| Dutch West Indians | 0.0 /100 | #324 | Tragic $77,260 |
| Sioux | 0.0 /100 | #325 | Tragic $77,089 |
| Houma | 0.0 /100 | #326 | Tragic $77,044 |
| Immigrants | Bahamas | 0.0 /100 | #327 | Tragic $76,910 |
| Immigrants | Cuba | 0.0 /100 | #328 | Tragic $76,701 |
| Seminole | 0.0 /100 | #329 | Tragic $76,584 |
| Yakama | 0.0 /100 | #330 | Tragic $76,226 |
| Natives/Alaskans | 0.0 /100 | #331 | Tragic $75,647 |
| Bahamians | 0.0 /100 | #332 | Tragic $75,395 |
| Hopi | 0.0 /100 | #333 | Tragic $75,002 |
| Creek | 0.0 /100 | #334 | Tragic $74,847 |
| Kiowa | 0.0 /100 | #335 | Tragic $74,776 |