Cherokee vs Honduran Householder Income Ages 25 - 44 years
COMPARE
Cherokee
Honduran
Householder Income Ages 25 - 44 years
Householder Income Ages 25 - 44 years Comparison
Cherokee
Hondurans
$80,843
HOUSEHOLDER INCOME AGES 25 - 44 YEARS
0.0/ 100
METRIC RATING
300th/ 347
METRIC RANK
$78,540
HOUSEHOLDER INCOME AGES 25 - 44 YEARS
0.0/ 100
METRIC RATING
319th/ 347
METRIC RANK
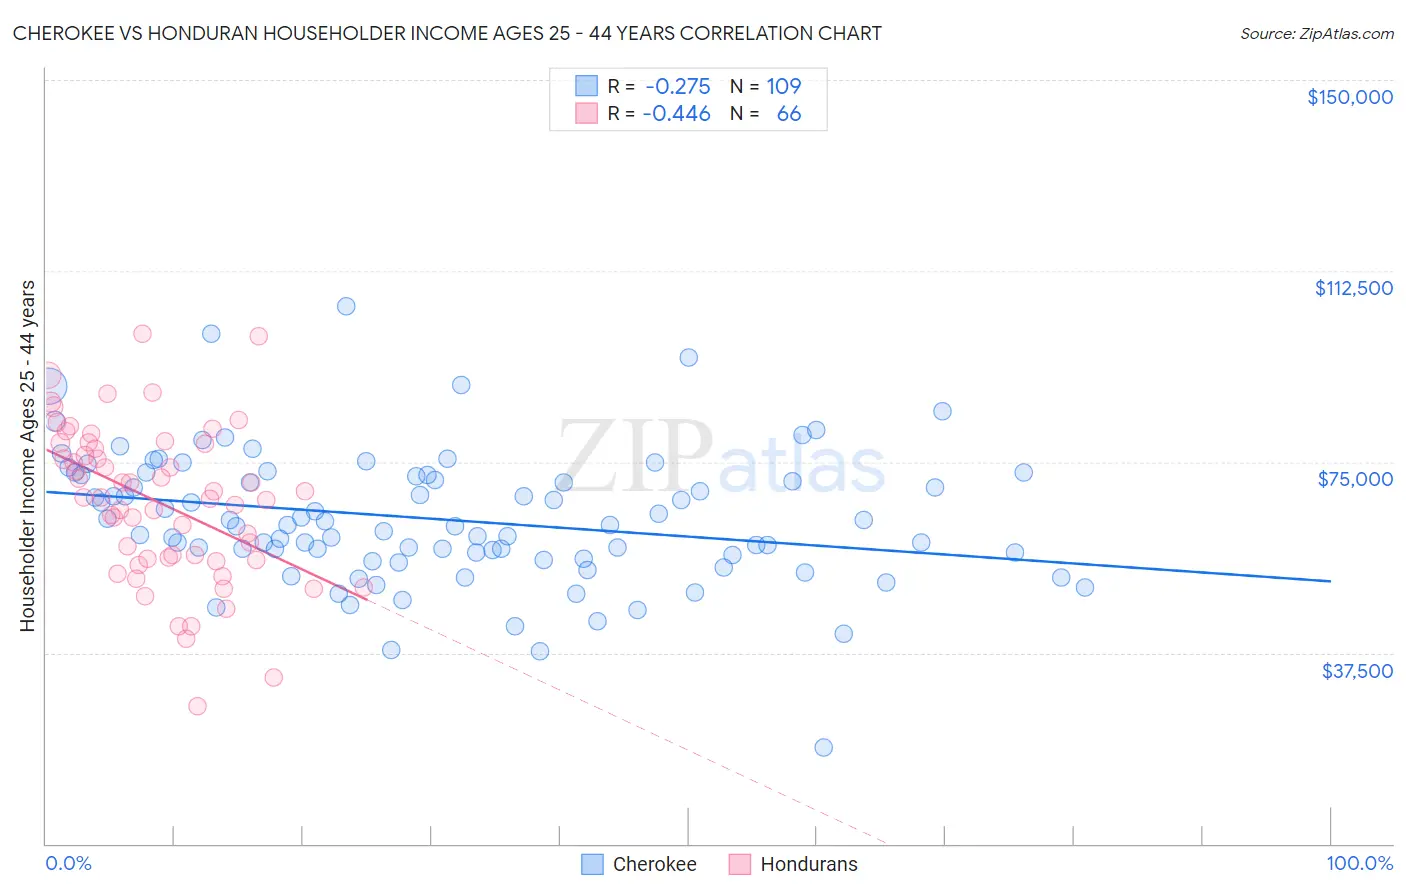
Cherokee vs Honduran Householder Income Ages 25 - 44 years Correlation Chart
The statistical analysis conducted on geographies consisting of 490,925,760 people shows a weak negative correlation between the proportion of Cherokee and household income with householder between the ages 25 and 44 in the United States with a correlation coefficient (R) of -0.275 and weighted average of $80,843. Similarly, the statistical analysis conducted on geographies consisting of 357,079,818 people shows a moderate negative correlation between the proportion of Hondurans and household income with householder between the ages 25 and 44 in the United States with a correlation coefficient (R) of -0.446 and weighted average of $78,540, a difference of 2.9%.
Householder Income Ages 25 - 44 years Correlation Summary
| Measurement | Cherokee | Honduran |
| Minimum | $18,882 | $26,956 |
| Maximum | $105,572 | $100,173 |
| Range | $86,690 | $73,217 |
| Mean | $63,770 | $67,051 |
| Median | $62,500 | $68,041 |
| Interquartile 25% (IQ1) | $56,304 | $56,015 |
| Interquartile 75% (IQ3) | $72,426 | $78,438 |
| Interquartile Range (IQR) | $16,122 | $22,423 |
| Standard Deviation (Sample) | $13,175 | $15,191 |
| Standard Deviation (Population) | $13,114 | $15,075 |
Demographics Similar to Cherokee and Hondurans by Householder Income Ages 25 - 44 years
In terms of householder income ages 25 - 44 years, the demographic groups most similar to Cherokee are Immigrants from Liberia ($80,863, a difference of 0.020%), Immigrants from Micronesia ($80,544, a difference of 0.37%), Hispanic or Latino ($80,515, a difference of 0.41%), Mexican ($80,427, a difference of 0.52%), and Immigrants from Caribbean ($80,326, a difference of 0.64%). Similarly, the demographic groups most similar to Hondurans are Immigrants from Mexico ($78,809, a difference of 0.34%), U.S. Virgin Islander ($78,911, a difference of 0.47%), African ($78,986, a difference of 0.57%), Ottawa ($79,012, a difference of 0.60%), and Cheyenne ($79,152, a difference of 0.78%).
| Demographics | Rating | Rank | Householder Income Ages 25 - 44 years |
| Immigrants | Liberia | 0.1 /100 | #299 | Tragic $80,863 |
| Cherokee | 0.0 /100 | #300 | Tragic $80,843 |
| Immigrants | Micronesia | 0.0 /100 | #301 | Tragic $80,544 |
| Hispanics or Latinos | 0.0 /100 | #302 | Tragic $80,515 |
| Mexicans | 0.0 /100 | #303 | Tragic $80,427 |
| Immigrants | Caribbean | 0.0 /100 | #304 | Tragic $80,326 |
| Immigrants | Dominican Republic | 0.0 /100 | #305 | Tragic $80,319 |
| Apache | 0.0 /100 | #306 | Tragic $80,260 |
| Haitians | 0.0 /100 | #307 | Tragic $80,055 |
| Immigrants | Central America | 0.0 /100 | #308 | Tragic $80,012 |
| Chippewa | 0.0 /100 | #309 | Tragic $80,005 |
| Fijians | 0.0 /100 | #310 | Tragic $79,956 |
| Indonesians | 0.0 /100 | #311 | Tragic $79,543 |
| Immigrants | Haiti | 0.0 /100 | #312 | Tragic $79,391 |
| Menominee | 0.0 /100 | #313 | Tragic $79,358 |
| Cheyenne | 0.0 /100 | #314 | Tragic $79,152 |
| Ottawa | 0.0 /100 | #315 | Tragic $79,012 |
| Africans | 0.0 /100 | #316 | Tragic $78,986 |
| U.S. Virgin Islanders | 0.0 /100 | #317 | Tragic $78,911 |
| Immigrants | Mexico | 0.0 /100 | #318 | Tragic $78,809 |
| Hondurans | 0.0 /100 | #319 | Tragic $78,540 |