Immigrants from Uganda vs Carpatho Rusyn 3rd Grade
COMPARE
Immigrants from Uganda
Carpatho Rusyn
3rd Grade
3rd Grade Comparison
Immigrants from Uganda
Carpatho Rusyns
97.7%
3RD GRADE
27.4/ 100
METRIC RATING
194th/ 347
METRIC RANK
98.5%
3RD GRADE
100.0/ 100
METRIC RATING
14th/ 347
METRIC RANK
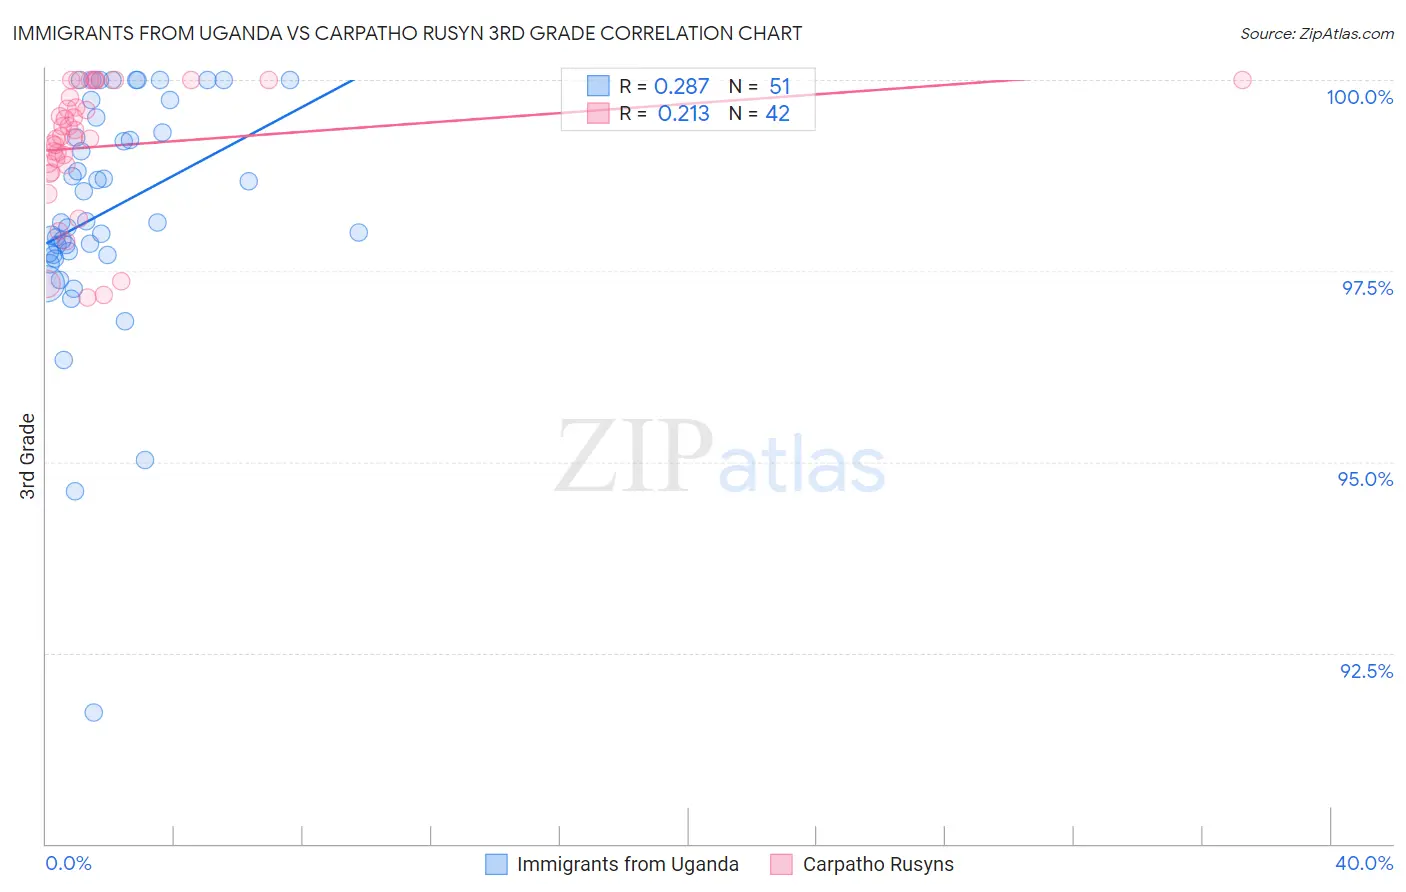
Immigrants from Uganda vs Carpatho Rusyn 3rd Grade Correlation Chart
The statistical analysis conducted on geographies consisting of 125,908,537 people shows a weak positive correlation between the proportion of Immigrants from Uganda and percentage of population with at least 3rd grade education in the United States with a correlation coefficient (R) of 0.287 and weighted average of 97.7%. Similarly, the statistical analysis conducted on geographies consisting of 58,871,690 people shows a weak positive correlation between the proportion of Carpatho Rusyns and percentage of population with at least 3rd grade education in the United States with a correlation coefficient (R) of 0.213 and weighted average of 98.5%, a difference of 0.89%.
3rd Grade Correlation Summary
| Measurement | Immigrants from Uganda | Carpatho Rusyn |
| Minimum | 91.7% | 97.2% |
| Maximum | 100.0% | 100.0% |
| Range | 8.3% | 2.8% |
| Mean | 98.3% | 99.1% |
| Median | 98.1% | 99.3% |
| Interquartile 25% (IQ1) | 97.7% | 98.9% |
| Interquartile 75% (IQ3) | 99.5% | 99.8% |
| Interquartile Range (IQR) | 1.8% | 0.88% |
| Standard Deviation (Sample) | 1.6% | 0.82% |
| Standard Deviation (Population) | 1.5% | 0.81% |
Similar Demographics by 3rd Grade
Demographics Similar to Immigrants from Uganda by 3rd Grade
In terms of 3rd grade, the demographic groups most similar to Immigrants from Uganda are Immigrants from Kenya (97.7%, a difference of 0.0%), Immigrants from Egypt (97.7%, a difference of 0.0%), Black/African American (97.7%, a difference of 0.010%), Mongolian (97.7%, a difference of 0.010%), and Paraguayan (97.7%, a difference of 0.010%).
| Demographics | Rating | Rank | 3rd Grade |
| Natives/Alaskans | 35.2 /100 | #187 | Fair 97.7% |
| Immigrants | Taiwan | 34.2 /100 | #188 | Fair 97.7% |
| Pakistanis | 34.2 /100 | #189 | Fair 97.7% |
| Panamanians | 31.5 /100 | #190 | Fair 97.7% |
| Blacks/African Americans | 29.6 /100 | #191 | Fair 97.7% |
| Mongolians | 29.1 /100 | #192 | Fair 97.7% |
| Immigrants | Kenya | 28.2 /100 | #193 | Fair 97.7% |
| Immigrants | Uganda | 27.4 /100 | #194 | Fair 97.7% |
| Immigrants | Egypt | 26.8 /100 | #195 | Fair 97.7% |
| Paraguayans | 26.2 /100 | #196 | Fair 97.7% |
| Hawaiians | 25.7 /100 | #197 | Fair 97.7% |
| Guamanians/Chamorros | 23.6 /100 | #198 | Fair 97.7% |
| Immigrants | Ukraine | 22.7 /100 | #199 | Fair 97.7% |
| Immigrants | Albania | 22.6 /100 | #200 | Fair 97.7% |
| Immigrants | Lebanon | 21.7 /100 | #201 | Fair 97.7% |
Demographics Similar to Carpatho Rusyns by 3rd Grade
In terms of 3rd grade, the demographic groups most similar to Carpatho Rusyns are English (98.6%, a difference of 0.0%), Tlingit-Haida (98.5%, a difference of 0.0%), Swedish (98.5%, a difference of 0.010%), Slovene (98.6%, a difference of 0.020%), and Alaska Native (98.6%, a difference of 0.030%).
| Demographics | Rating | Rank | 3rd Grade |
| Norwegians | 100.0 /100 | #7 | Exceptional 98.6% |
| Slovaks | 100.0 /100 | #8 | Exceptional 98.6% |
| Germans | 100.0 /100 | #9 | Exceptional 98.6% |
| Alaska Natives | 100.0 /100 | #10 | Exceptional 98.6% |
| Slovenes | 100.0 /100 | #11 | Exceptional 98.6% |
| English | 100.0 /100 | #12 | Exceptional 98.6% |
| Tlingit-Haida | 100.0 /100 | #13 | Exceptional 98.5% |
| Carpatho Rusyns | 100.0 /100 | #14 | Exceptional 98.5% |
| Swedes | 100.0 /100 | #15 | Exceptional 98.5% |
| Scottish | 100.0 /100 | #16 | Exceptional 98.5% |
| Dutch | 100.0 /100 | #17 | Exceptional 98.5% |
| Irish | 100.0 /100 | #18 | Exceptional 98.5% |
| Poles | 100.0 /100 | #19 | Exceptional 98.5% |
| Pennsylvania Germans | 100.0 /100 | #20 | Exceptional 98.5% |
| Lithuanians | 100.0 /100 | #21 | Exceptional 98.5% |