Barbadian vs Immigrants from England Householder Income Ages 45 - 64 years
COMPARE
Barbadian
Immigrants from England
Householder Income Ages 45 - 64 years
Householder Income Ages 45 - 64 years Comparison
Barbadians
Immigrants from England
$90,266
HOUSEHOLDER INCOME AGES 45 - 64 YEARS
0.6/ 100
METRIC RATING
253rd/ 347
METRIC RANK
$109,446
HOUSEHOLDER INCOME AGES 45 - 64 YEARS
99.0/ 100
METRIC RATING
77th/ 347
METRIC RANK
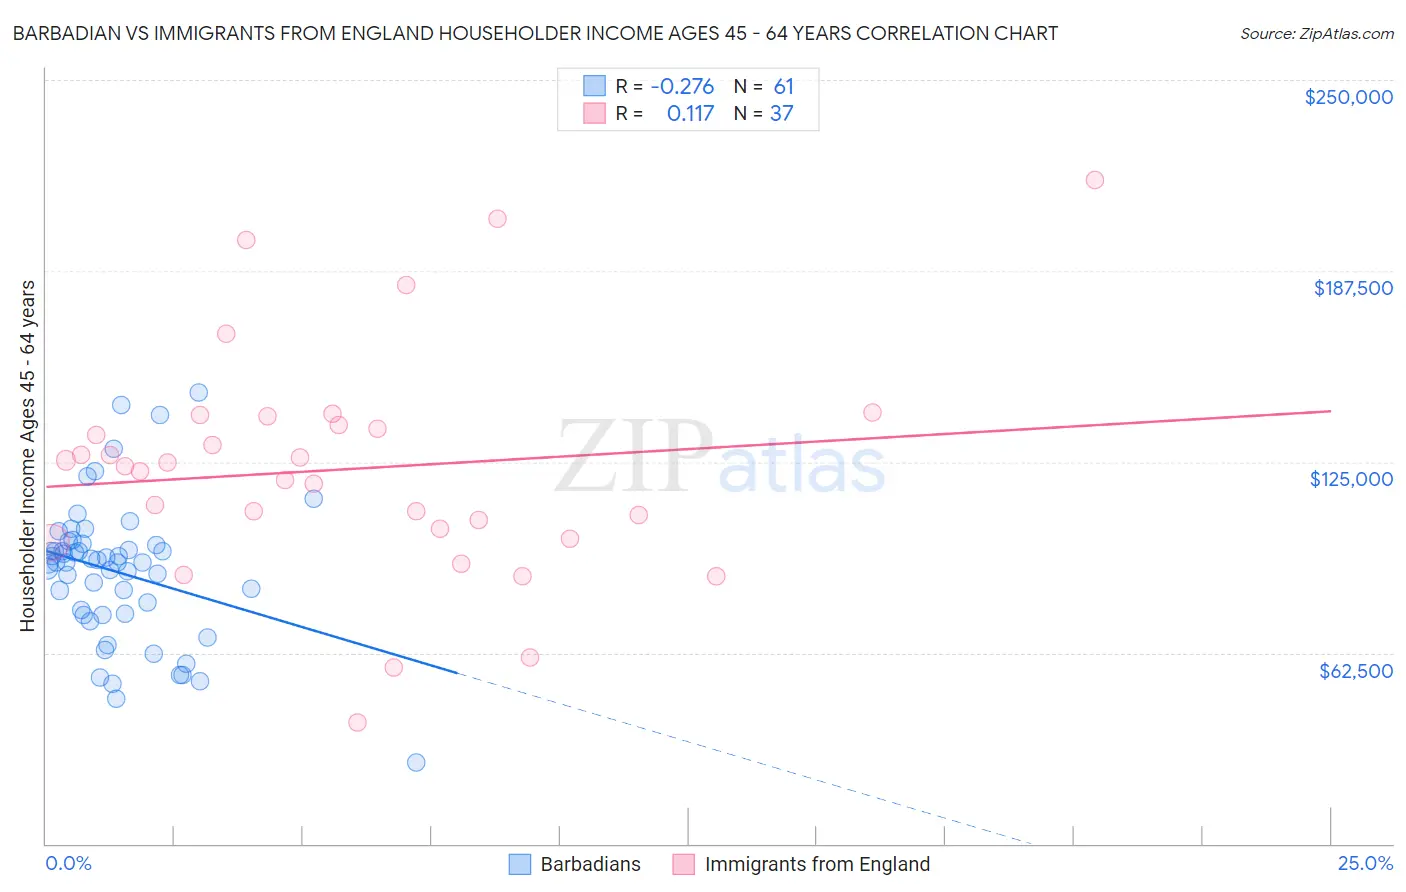
Barbadian vs Immigrants from England Householder Income Ages 45 - 64 years Correlation Chart
The statistical analysis conducted on geographies consisting of 141,200,649 people shows a weak negative correlation between the proportion of Barbadians and household income with householder between the ages 45 and 64 in the United States with a correlation coefficient (R) of -0.276 and weighted average of $90,266. Similarly, the statistical analysis conducted on geographies consisting of 391,386,489 people shows a poor positive correlation between the proportion of Immigrants from England and household income with householder between the ages 45 and 64 in the United States with a correlation coefficient (R) of 0.117 and weighted average of $109,446, a difference of 21.2%.
Householder Income Ages 45 - 64 years Correlation Summary
| Measurement | Barbadian | Immigrants from England |
| Minimum | $26,458 | $39,802 |
| Maximum | $147,517 | $217,188 |
| Range | $121,059 | $177,386 |
| Mean | $88,874 | $122,668 |
| Median | $92,167 | $123,541 |
| Interquartile 25% (IQ1) | $75,253 | $101,375 |
| Interquartile 75% (IQ3) | $97,931 | $138,511 |
| Interquartile Range (IQR) | $22,678 | $37,136 |
| Standard Deviation (Sample) | $22,976 | $37,553 |
| Standard Deviation (Population) | $22,787 | $37,042 |
Similar Demographics by Householder Income Ages 45 - 64 years
Demographics Similar to Barbadians by Householder Income Ages 45 - 64 years
In terms of householder income ages 45 - 64 years, the demographic groups most similar to Barbadians are Immigrants from Guyana ($90,186, a difference of 0.090%), Marshallese ($90,455, a difference of 0.21%), American ($90,536, a difference of 0.30%), West Indian ($89,906, a difference of 0.40%), and Subsaharan African ($90,691, a difference of 0.47%).
| Demographics | Rating | Rank | Householder Income Ages 45 - 64 years |
| Central Americans | 0.9 /100 | #246 | Tragic $90,951 |
| Alaskan Athabascans | 0.9 /100 | #247 | Tragic $90,951 |
| Immigrants | Laos | 0.9 /100 | #248 | Tragic $90,909 |
| Mexican American Indians | 0.8 /100 | #249 | Tragic $90,811 |
| Sub-Saharan Africans | 0.8 /100 | #250 | Tragic $90,691 |
| Americans | 0.7 /100 | #251 | Tragic $90,536 |
| Marshallese | 0.7 /100 | #252 | Tragic $90,455 |
| Barbadians | 0.6 /100 | #253 | Tragic $90,266 |
| Immigrants | Guyana | 0.6 /100 | #254 | Tragic $90,186 |
| West Indians | 0.5 /100 | #255 | Tragic $89,906 |
| French American Indians | 0.5 /100 | #256 | Tragic $89,811 |
| German Russians | 0.4 /100 | #257 | Tragic $89,398 |
| Immigrants | Barbados | 0.4 /100 | #258 | Tragic $89,394 |
| Immigrants | Nicaragua | 0.4 /100 | #259 | Tragic $89,108 |
| Liberians | 0.3 /100 | #260 | Tragic $88,929 |
Demographics Similar to Immigrants from England by Householder Income Ages 45 - 64 years
In terms of householder income ages 45 - 64 years, the demographic groups most similar to Immigrants from England are Paraguayan ($109,447, a difference of 0.0%), Immigrants from Canada ($109,402, a difference of 0.040%), Immigrants from Bulgaria ($109,379, a difference of 0.060%), Jordanian ($109,376, a difference of 0.060%), and Immigrants from Eastern Europe ($109,335, a difference of 0.10%).
| Demographics | Rating | Rank | Householder Income Ages 45 - 64 years |
| Koreans | 99.3 /100 | #70 | Exceptional $110,334 |
| Italians | 99.3 /100 | #71 | Exceptional $110,224 |
| Assyrians/Chaldeans/Syriacs | 99.3 /100 | #72 | Exceptional $110,201 |
| Argentineans | 99.3 /100 | #73 | Exceptional $110,103 |
| Immigrants | Egypt | 99.2 /100 | #74 | Exceptional $109,941 |
| South Africans | 99.1 /100 | #75 | Exceptional $109,719 |
| Paraguayans | 99.0 /100 | #76 | Exceptional $109,447 |
| Immigrants | England | 99.0 /100 | #77 | Exceptional $109,446 |
| Immigrants | Canada | 99.0 /100 | #78 | Exceptional $109,402 |
| Immigrants | Bulgaria | 98.9 /100 | #79 | Exceptional $109,379 |
| Jordanians | 98.9 /100 | #80 | Exceptional $109,376 |
| Immigrants | Eastern Europe | 98.9 /100 | #81 | Exceptional $109,335 |
| Immigrants | North America | 98.8 /100 | #82 | Exceptional $109,198 |
| Immigrants | Spain | 98.8 /100 | #83 | Exceptional $109,051 |
| Immigrants | Western Europe | 98.6 /100 | #84 | Exceptional $108,824 |